
APPENDIX A. ANALYSIS OF VULNERABILITY TO HEAT BASED ON HISTORICAL AND FUTURE TEMPERATURE, AS WELL AS SOCIOECONOMIC FACTORS
Nick Silverman, Bruce Maxwell, and Robert Byron
Multi-criteria Decision Analysis
We used Multi-criteria decision analysis (MCDA) to categorize vulnerability to heat across the state of Montana. MCDA is a statistical method of weighting different layers of contributing information to provide a qualitative description of risk. The method has been applied to a wide range of topics in risk analysis (Chi 2010, Ho et al. 2014). Several studies have used MCDA to better understand the relationship between land surface temperature (heat) and human health (Ho et al. 2015, Reid et al. 2009, Morabito et al. 2015). More locally, MCDA was used to map heat vulnerability across the city of Missoula, Montana (Thompkins 2018). The term decision analysis in the name comes from the original intent of the method to help inform decision-making by allowing decision makers with local knowledge to weigh different factors based on their intuitive sense of which factors may be most strongly associated with a response. In our case, how heat may associate with socioeconomic factors with different weightings to determine human health impact. We used this method to determine which counties in Montana may be most vulnerable to heat effects from climate change.
Exposure Calculations
In our analysis, we define vulnerability as having three main components: 1) heat exposure; 2) heat sensitivity; and 3) adaptive capacity. Exposure is the direct effect of heat based on temperature and humidity; sensitivity and adaptive capacity are combined through socioeconomic factors that make humans more susceptible to heat-related illness. We refer to these socioeconomic factors as sensitivity for this analysis. Exposure is further broken down into historical conditions and future change. Historical heat conditions for each county[1] were estimated using the Moderate Resolution Imaging Spectroradiometer (MODIS) Land Surface Temperature (daily average) and Emissivity (MOD11) approximately 1-km resolution satellite product (Wan et al. 2015). We calculated the 95th percentile land surface temperatures from 2000-2019 for each grid-cell and then averaged those by county creating an estimate of the historical land surface temperature for each county during the hottest climate events (i.e., falling within the top 95th quantile) during the study period. For future changes in heat projections, we used the heat index values by UCS (2019) for the 100°F threshold at mid century with the RCP8.5 scenario. The heat indices for each county were generated based on an ensemble of general circulation models and include a combination of temperature and humidity estimates to create a “feels like” temperature rating commonly used when estimating heat impacts on humans.
Sensitivity Calculations
We based our calculation of sensitivity on socioeconomic factors from the US Census Bureau, 2013-2017 American Community Survey 5-Year Estimates. We used county estimates of median household income assuming that if income was low the county population would have less ability to mitigate extreme heat. Percent of the county in poverty, percent of children in poverty, and percent of population unemployed[2] for a county were assumed to increase the likelihood of negative health impacts from heat. The percent of construction and production (those employed in production, transportation, and material movement) jobs were assumed to be related to increased exposure to heat because most of these jobs are outside or have little access to air conditioning. Percent of professional jobs, like household income, is thought to increase the potential for the population to survive extreme heat. In the cases of median household income and percent of professional jobs, the inverse ranking was used to associate with heat vulnerability. These mapped layers of information were selected by a panel of Montana healthcare experts as best indicators of heat vulnerability from the list available (Table A-1).
|
Table A-1. County rankings based on socioeconomic variables that are sensitive to heat using 2013-2017 data (closeness not used for ranking, but ranking associated with vulnerability so median income and percent professional jobs are ranked high if values are low and all other variables ranked from low to high). Two notes associated with the socioeconomic column: a) If average median household income was low for a county relative to the other counties in Montana then the rank would be high (i.e., more sensitive to heat); b) If the percentage of professional jobs in the county was low relative to other Montana counties then the rank would be high (i.e. more sensitive to heat).
|
||||
|
Socioeconmic variable |
Counties with low sensitivity rank (1-14) |
Counties with medium-low sensitivity rank (15-28) |
Counties with medium-high sensitivity rank (29-43) |
Counties with high sensitivity rank (44-56) |
|---|---|---|---|---|
|
Median household income |
Rosebud, Broadwater, Custer, Richland, Valley, Daniels, Fallon, Stillwater, Dawson, Yellowstone, Carbon, Gallatin, Lewis and Clark, Jefferson |
Sweet Grass, Garfield, Fergus, Big Horn, Granite, Wibaux, Sheridan, Prairie, Madison, Teton, Powder River, Cascade, Flathead, Missoula |
Pondera, Carter, Liberty, Ravalli, Petroleum, Beaverhead, Toole, Judith Basin, Powell, Park, McCone, Lake, Hill, Treasure, Golden Valley |
Musselshell, Chouteau, Meagher, Sanders, Lincoln, Wheatland, Phillips, Blaine, Roosevelt, Glacier, Mineral, Deer Lodge, Silver Bow |
|
% poverty |
Broadwater, Custer, Richland, Valley, Daniels, Fallon, Stillwater, Carbon, Jefferson, Garfield, Granite, Teton, Powder River, McCone |
Dawson, Yellowstone, Gallatin, Lewis and Clark, Sweet Grass, Wibaux, Sheridan, Prairie, Madison, Cascade, Flathead, Carter, Petroleum, Park |
Fergus, Missoula, Liberty, Ravalli, Beaverhead, Toole, Judith Basin, Powell, Treasure, Golden Valley, Musselshell, Meagher, Lincoln, Phillips, Deer Lodge |
Rosebud, Big Horn, Pondera, Lake, Hill, Chouteau, Sanders, Wheatland, Blaine, Roosevelt, Glacier, Mineral, Silver Bow |
|
% child poverty |
Broadwater, Custer, Richland, Valley, Daniels, Fallon, Stillwater, Garfield, Teton, Powder River, McCone, Gallatin, Wibaux, Beaverhead |
Carbon, Jefferson, Granite, Yellowstone, Lewis and Clark, Sweet Grass, Sheridan, Prairie, Madison, Cascade, Petroleum, Park, Missoula, Judith Basin |
Dawson, Flathead, Carter, Fergus, Liberty, Ravalli, Toole, Powell, Treasure, Musselshell, Meagher, Lincoln, Phillips, Deer Lodge, Silver Bow |
Golden Valley, Rosebud, Big Horn, Pondera, Lake, Hill, Chouteau, Sanders, Wheatland, Blaine, Roosevelt, Glacier, Mineral |
|
% construction jobs |
Custer, Gallatin, Jefferson, Granite, Yellowstone, Lewis and Clark, Cascade, Missoula, Flathead, Fergus, Silver Bow, Hill, Chouteau, Mineral |
Valley, Daniels, Beaverhead, Carbon, Sheridan, Park, Ravalli, Toole, Deer Lodge, Big Horn, Pondera, Lake, Roosevelt, Glacier |
Broadwater, Stillwater, Garfield, Teton, McCone, Wibaux, Prairie, Madison, Dawson, Carter, Powell, Musselshell, Meagher, Lincoln, Sanders, Blaine |
Richland, Fallon, Powder River, Sweet Grass, Petroleum, Judith Basin, Liberty, Treasure, Phillips, Golden Valley, Rosebud, Wheatland |
|
% production jobs |
Jefferson, Lewis and Clark, Missoula, Daniels, Carbon, Sheridan, Big Horn, Glacier, Garfield, McCone, Prairie, Madison, Carter, Petroleum, Judith Basin, Liberty, Treasure |
Custer, Gallatin, Cascade, Flathead, Fergus, Valley, Park, Toole, Powell, Blaine, Powder River, Wheatland |
Yellowstone, Chouteau, Beaverhead, Ravalli, Deer Lodge, Pondera, Lake, Broadwater, Teton, Wibaux, Lincoln, Phillips, Golden Valley, Rosebud |
Granite, Silver Bow, Hill, Mineral, Roosevelt, Stillwater, Dawson, Musselshell, Meagher, Sanders, Richland, Fallon, Sweet Grass |
|
% unemployment |
Daniels, Garfield, McCone, Liberty, Treasure, Custer, Toole, Powell, Deer Lodge, Teton, Wibaux, Dawson, Fallon, Sweet Grass |
Lewis and Clark, Sheridan, Prairie, Madison, Carter, Judith Basin, Fergus, Park, Powder River, Wheatland, Yellowstone, Chouteau, Meagher, Richland |
Jefferson, Missoula, Carbon, Petroleum, Gallatin, Cascade, Flathead, Valley, Beaverhead, Pondera, Broadwater, Golden Valley, Silver Bow, Stillwater, Musselshell |
Big Horn, Glacier, Blaine, Ravalli, Lake, Lincoln, Phillips, Rosebud, Granite, Hill, Mineral, Roosevelt, Sanders |
|
% professional jobs |
Garfield, Carter, Wibaux, Petroleum, Daniels, Prairie, Judith Basin, Powell, McCone, Powder River, Gallatin, Lewis and Clark, Jefferson, Missoula |
Chouteau, Meagher, Fergus, Broadwater, Valley, Sheridan, Blaine, Teton, Glacier, Hill, Treasure, Golden Valley, Carbon, Cascade |
Rosebud, Pondera, Big Horn, Granite, Custer, Ravalli, Phillips, Madison, Beaverhead, Park, Dawson, Lake, Yellowstone, Flathead, Silver Bow |
Musselshell, Sweet Grass, Liberty, Sanders, Lincoln, Richland, Wheatland, Toole, Roosevelt, Fallon, Stillwater, Mineral, Deer Lodge |
Weighting Scheme
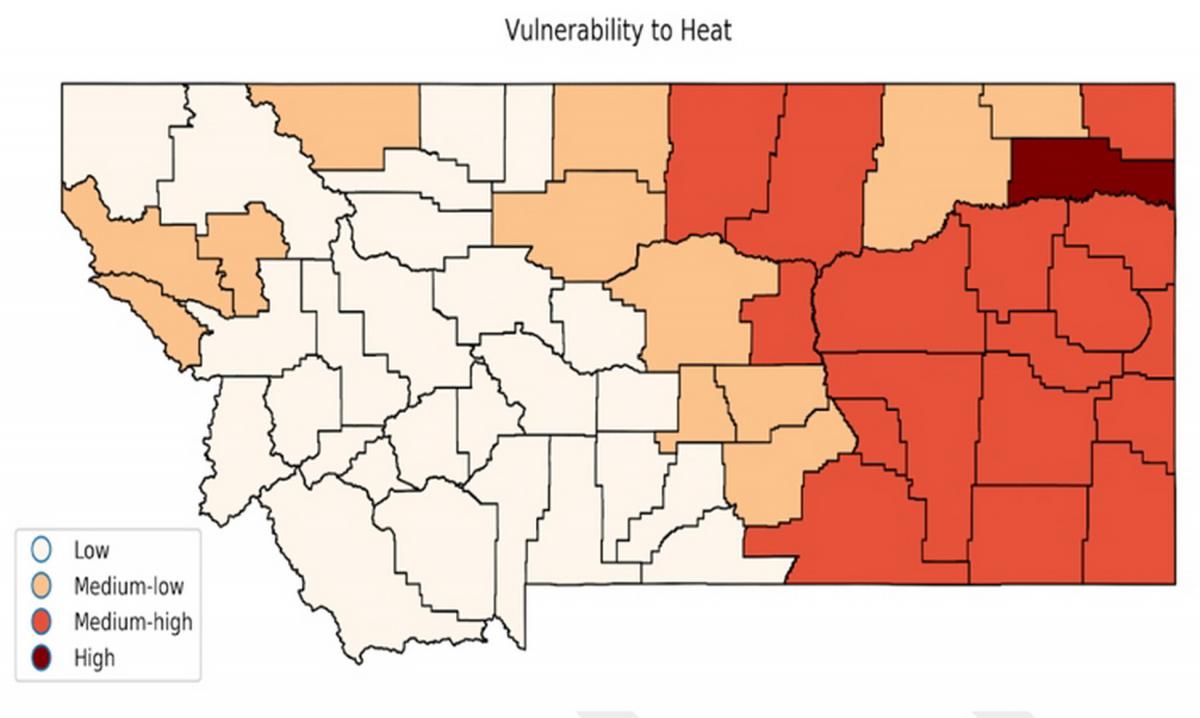
We weighted historical land surface temperatures and projected heat index by 0.255 and each socioeconomic factor by 0.07 so that the cumulative exposure layers and cumulative sensitivity layers were equally weighted (0.255 + 0.255 + 7*0.07 = 1.0). Income and percent of professional jobs were maximized while all other layers were minimized in the MCDA algorithm to minimize vulnerability. We used the closeness values calculated from the “skcriteria” Python library to calculate county vulnerability using the Technique for Order of Preference by Similarity to Ideal Solutions (TOPSIS) method (Sevachandran et al. 2018). Closeness represents how far each county’s subset of socioeconomic variables, chosen to represent vulnerability, depart from the ideal set (Hwang and Yoon, 1981). Closeness values are normalized to be between 0 and 1. We grouped counties with closeness values below 0.25, between 0.25 and 0.50, above 0.50 and below 0.75 and above 0.75 into low, medium-low, medium-high and high vulnerability ratings, respectively.
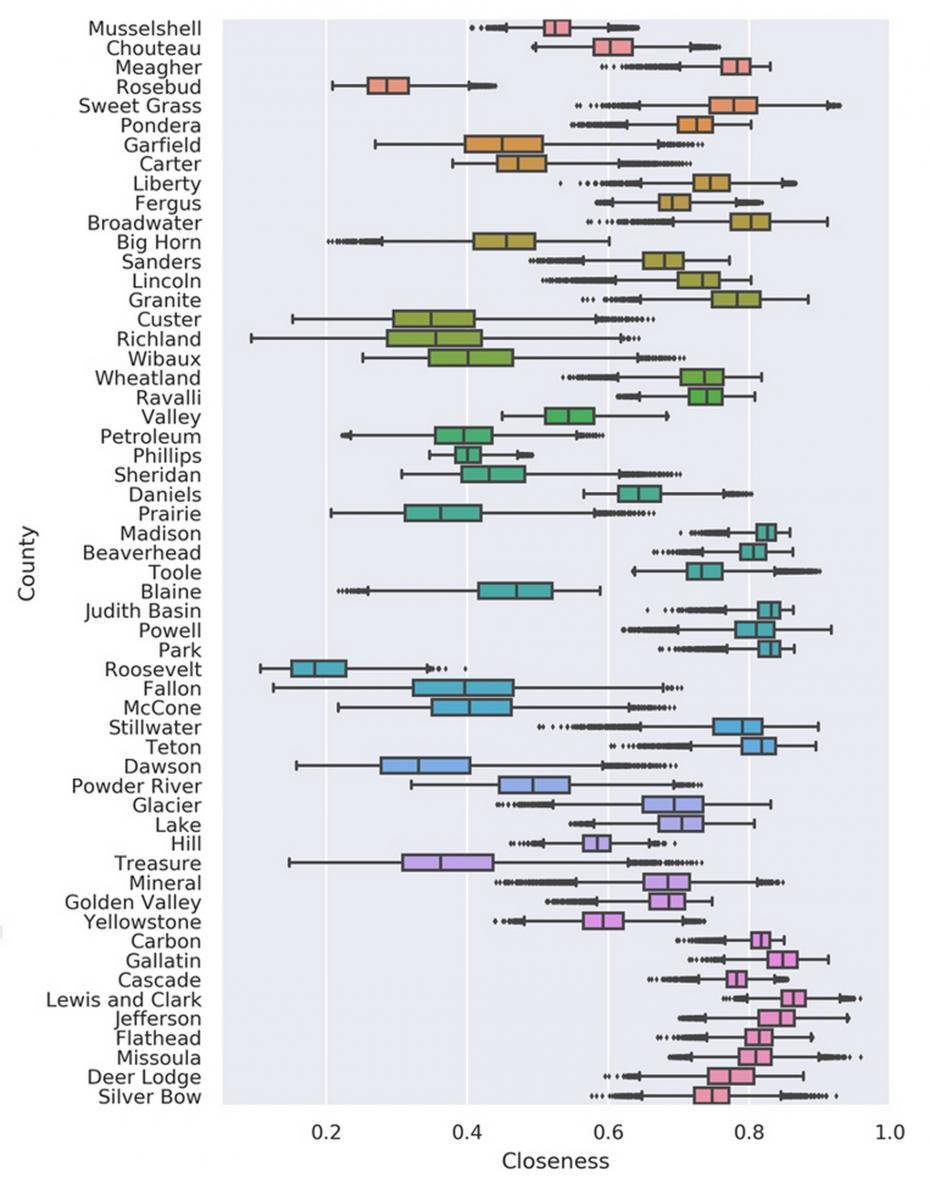
In the absence of additional information, we assumed that each of the socioeconomic factors were equally weighted to represent sensitivity to heat. We know that certain factors are likely to have a stronger influence in some counties, but equal weighting was the best assumption without a detailed investigation into the variation in epidemiology of heat-related illness in Montana. To assess the uncertainty in our assumption, we performed a Monte-Carlo analysis on our weighting scheme for the different variables. We ran 10,000 simulations where socioeconomic variables were randomly assigned a weight using a Dirichlet distribution (a family of continuous multivariate probability distributions representing the socioeconomic variables) and then forced the sum of the weights corresponding to the 7 socioeconomic variables to equal 0.49. We kept the exposure weights constant at 0.255 for both historical and future predicted heat.
Results
The higher the rank values the more vulnerable a county’s population is to heat. One county in Montana has a high vulnerability rating, while 17 have a medium-high rating, 12 have a medium-low rating, and 26 have a low rating (Figure A-1). There is a strong west-to-east increasing trend in vulnerability that mostly results from the patterns of exposure (i.e., land surface temperatures and projected heat are highest in eastern Montana). Roosevelt County ranked 29 for historical heat and 51 for future predicted heat relative to the other 56 counties, making it one of the top five counties for projected extreme heat in Montana. Roosevelt’s high heat ranking coupled with a number of other factors—a) relatively high unemployment; b) low median income; c) low number of professional jobs; d) high poverty levels; and e) high number of agricultural production jobs—make it highly vulnerable to human health impacts from heat. While Roosevelt County is the only county with a “high” vulnerability rating, it is important to remember the uncertainty in the socioeconomic weight assignments when evaluating these results.
The uncertainty analysis shows that there is variability in the sensitivity of the county ratings to the socioeconomic weights (Figure A-2). In some counties, such as Madison and Carbon, the closeness values were less sensitive to the weights, while in other counties, such as Richland and Fallon, there was larger variability. In general, the uncertainty results suggest that when clumped into the four categories (low, medium-low, medium-high, and high) the results are robust and that most of the ratings are stay the same irrespective of the weighting scheme. This finding increases our confidence in the general relative vulnerability prediction.
[1] See Figure 2-1 for a map naming Montana’s 56 counties.
[2] It is important to recognize that data and discussion on percent employment, as presented in this analysis, are from well before the 2020 COVID-19 pandemic.
Literature Cited
Chi G. 2010. Land developability: developing an index of land use and development for population research. Journal of Maps 2010(1):609-17.
Ho HC, Mylroie J, Infante L, Rodgers III J. 2014. Fuzzy-based spatial modeling approach to predict island karst distribution. Environmental Earth Sciences 71:1369–77
Ho HC, Knudby A, Huang W. 2015. A spatial framework to map heat health risks at multiple scales. International Journal of Environmental Research and Public Health 12:16110–23. doi:10.3390/ijerph121215046.
Hwang CL, Yoon K. 1981. Methods for multiple attribute decision-making [chapter]. In: Multiple attribute decision-making. Berlin GDR: Springer. p 58-191.
Morabito M, Crisci A, Gioli B, Gualtieri G, Toscano P, di Stefano V, Orlandini S, Gensini GF. 2015. Urban-hazard risk analysis: mapping of heat-related risks in the elderly in major Italian cities. PLOS ONE 10(5):e0127277. https://doi.org/10.1371/journal.pone.0127277.
Reid CE, O’Neill MS, Gronlund CJ, Brines SJ, Brown DG, Diez-Roux AV, Schwartz J. 2009. Mapping community determinants of heat vulnerability. Environmental Health Perspectives 117:1730-6.
Sevachandran G, Quek SG, Smarandache F, Broumi S. 2018. An extended technique for order preference by similarity to an ideal solution (TOPSIS) with maximizing deviation method based on integrates weight measure for single-valued neutrosophic sets. Symmetry 10:236. doi:10.3390/sym10070236.
Thompkins J. 2018. Just open a window: understanding the vulnerability to summer heat of a mountain community in the western United States, Missoula, MT [master’s thesis]. Missoula MT: University of Montana. 53 p. Available online https://pdfs.semanticscholar.org/889e/1883fe683f37bac12602f944314bd0a317.... Accessed 14 May 2020.
[UCS] Union of Concerned Scientists. 2019. Killer heat in the United States; climate choices and the future of dangerously hot days [report]. Dahl K, Spanger-Siegfried E, Licker R, Caldas A, Abatzoglou J, Mailloux N, Cleetus R, Udvardy S, Declet-Barreto J, Worth P, authors. Available online https://www.ucsusa.org/sites/default/files/attach/2019/07/killer-heat-analysis-full-report.pdf. Accessed 15 Sep 2019.
Wan Z, Hook S, Hulley G. 2015. MYD11A1 MODIS/Terra Land Surface Temperature/Emissivity Daily L3 Global 1km SIN Grid V006 [data set]. NASA EOSDIS Land Processes DAAC. Available online https://doi.org/10.5067/MODIS/MOD11A1.006. Accessed 26 Jun 2019.