03. CLIMATE-RELATED HEALTH IMPACTS
Robert Byron, Bruce Maxwell, Nick Silverman, Philip Higuera, Madison Boone, and Dave McWethy
The consequences of climate change in Montana—including more frequent and intense heat waves; and increases in spring flooding, late-summer drought, extreme weather events, and wildfires—have recognized potential to impact human health (Ebi et al. 2018). Though little studied for Montana to date, climate change is known to be adversely impacting global health, including some Americans, now. For example, an increase in climate-related extreme events has led to increased emergency room visits and hospital admissions in the US (Ebi et al. 2018). Those adverse impacts are expected to increase over coming decades (Wuebbles et al. 2017).
Figure 3-1 depicts how climate pressures (also called stressors), following multiple exposure pathways, can lead to specific health outcomes for people. Those outcomes, discussed in this section, include heat-related illness; vector-borne diseases; mental health impacts; physical trauma, injuries, and death; respiratory, cardiovascular, and gastrointestinal conditions; and adverse effects on pregnancies and birth outcomes.
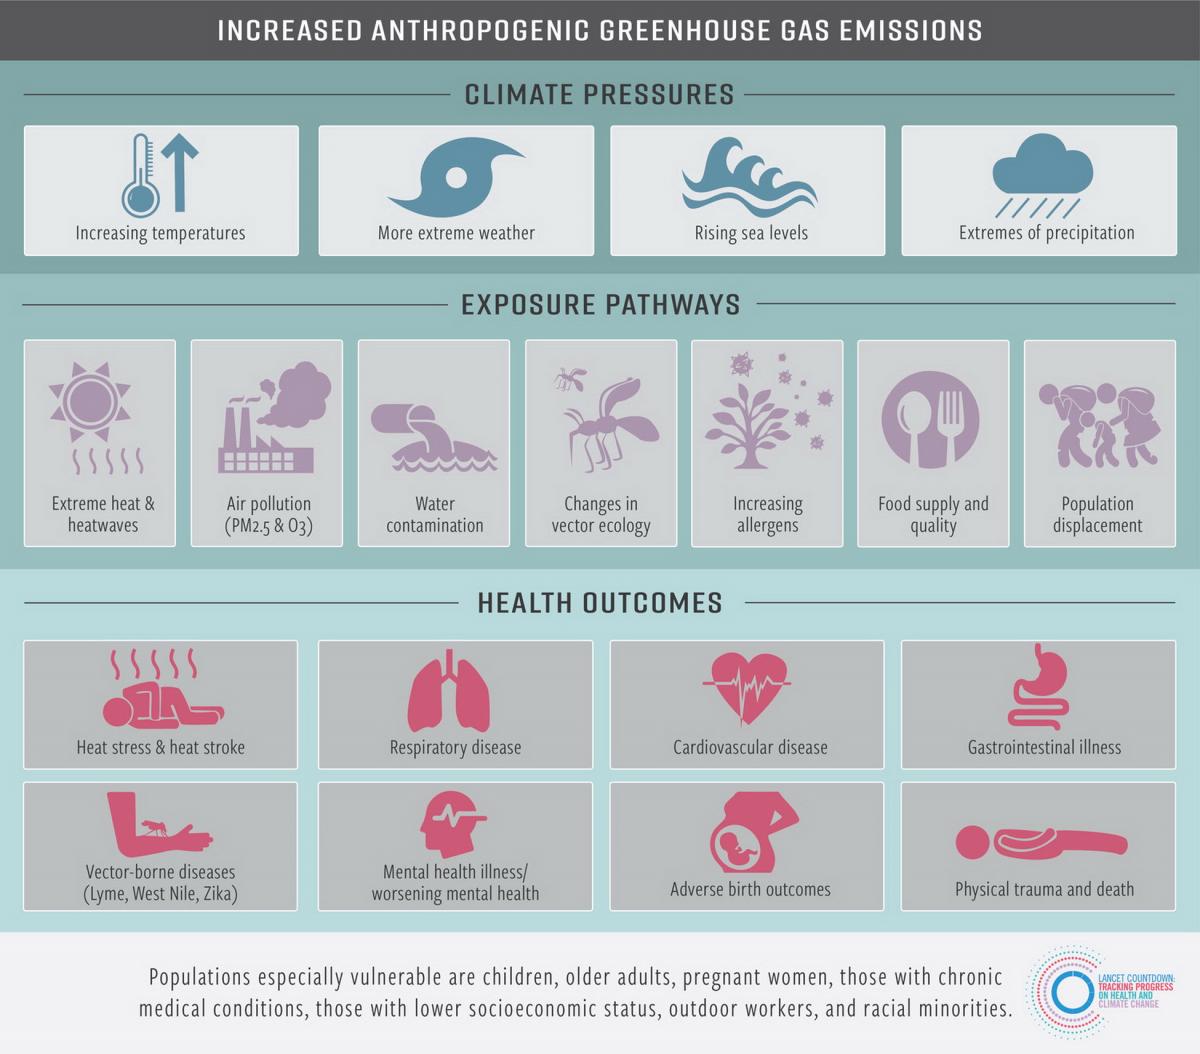
While climate change affects all parts of the world, the severity of specific health impacts will vary by the specific climate pressure, as well as by location. Coastal regions, for example, will endure the most damage from sea-level rise, whereas inland states like Montana will be impacted most by the adverse effects of heat waves and reduced air and water quality (from wildfire smoke, desertification, land degradation, and other factors [Hughes and Diaz 2008; Sharratt et al. 2017]).[1] In the subsections that follow, we describe some of the exposure pathways and health outcomes resulting from climate change as shown in Figure 3-1. Some of the discussion may apply globally, but we emphasize those pathways and outcomes more likely to impact Montanans.
Extreme Heat
Climate change is increasing the intensity and frequency of heat waves (Meehi and Tebaldi 2004; Reid et al. 2009). Globally, 157 million more people were exposed to extreme heat in 2017 than in 2000 (Watts et al. 2018). Assuming no changes in the current trend of emissions, the Union of Concerned Scientists projects that by mid century “the number of people [in the United States] experiencing 30 or more days with a heat index above 105°F in an average year will increase from just under 900,000 to more than 90 million—nearly one-third of the US population” (UCS 2019). Similarly, by the end of the century parts of Montana could see as many as 54 additional days over 90oF (32oC) (Whitlock et al. 2017; Section 2).
Multiple studies have demonstrated increased mortality associated with heat waves (Knowlton et al. 2009; Ostro et al. 2009; Isaksen et al. 2016), which is the major cause of weather-related deaths in the United States (NWS undated) (see sidebar). Gubernot et al. (2015) find that people who work in agriculture or construction jobs have the highest risk for heat-related death; that risk may be even higher for employees of Montana businesses such as farms and small construction firms that have no backup personnel. This finding should concern Montanans given that agriculture and construction are integral to our state’s economy.
In addition, American Indian ceremonial practices (e.g., sundances) become more difficult during extreme heat and expose participants to risk for heat-related conditions (Doyle et al. 2013).
Which is More Deadly—Extreme Heat or Extreme Cold?
This seemingly simple question actually has no clear answer. Temperature extremes in both directions kill hundreds of people in the US each year, but determining the actual death toll is subject to large errors. Two US agencies, using different methods and datasets, came to opposite conclusions about which is more deadly:
- NOAA’s monthly publication Storm Data (NOAA-NCEIa) regularly reports many more deaths per year as heat-related than as cold-related (NOAA-NCEIb). For example, their annual summary for 2011 indicates 206 deaths from extreme heat versus 29 from extreme cold.
- The Centers for Disease Control and Prevention’s National Center for Health Statistics analyzed death certificates in the US and came to the opposite conclusion, finding roughly twice as many people die of “excessive cold” conditions than of “excessive heat” (Berko et al. 2014). About 1300 deaths per year from 2006-2010 were coded as resulting from extreme cold exposure, whereas 670 deaths per year were attributed to extreme heat.
The different findings depend, at least in part, on whether the focus is on acute or short-term responses to extreme weather or, alternatively, seasonal differences in estimates of daily mortality. Abnormally cold conditions may have little effect on estimates of daily mortality; rather deaths in winter increase as a result of non-weather-related diseases, like influenza. In addition, a recent study noted that a large majority of cold-related deaths occur under moderately cold conditions, so a reduction in extreme cold due to global warming is not expected to cause a large reduction in cold-related deaths (Gasparrini et al. 2015). It is also widely accepted that direct attribution (in medical records) of cause of death underestimates the number of people who die from temperature extremes (Sarofim et al. 2016). For example, a person who dies from a heart attack that resulted from heat or cold exposure is listed only as having died from a heart attack, even though extreme temperature exposure may have hastened or triggered the attack.
Looking to the future, the Fourth National Climate Assessment found that under an upper-bound (RCP8.5) emissions scenario we should expect a large increase in US extreme temperature deaths. In 49 large US cities, representing one-third of the nation’s population, the report projected that changes in extreme hot and extreme cold temperatures would result in 9300 additional premature deaths per year by 2090, at a cost of $140 billion per year in 2015 dollars (Ebi et al. 2018). Since the study only covered populations in large cities, Montana was not included. These mortality estimates may be reduced through adaptation efforts such as acclimatization programs (e.g., ensuring adequate heating and cooling systems, and improved insulation). The report also considered the reduction in extreme cold deaths expected in a warmer climate; approximately 100 fewer cold deaths per year were expected in the US by 2050, with no further reduction in cold deaths between 2050 and 2090 (Ebi et al. 2018)
The bottom line is that high and low temperature extremes affect vulnerable populations, such as the unwell, the poor, the young, and the elderly, among others. Understanding the extreme-temperature risk for the future requires additional in-depth study of the interaction between temperature-related deaths and socioeconomic factors. With additional information, we can avoid adverse policy outcomes and achieve effective adaptation strategies.
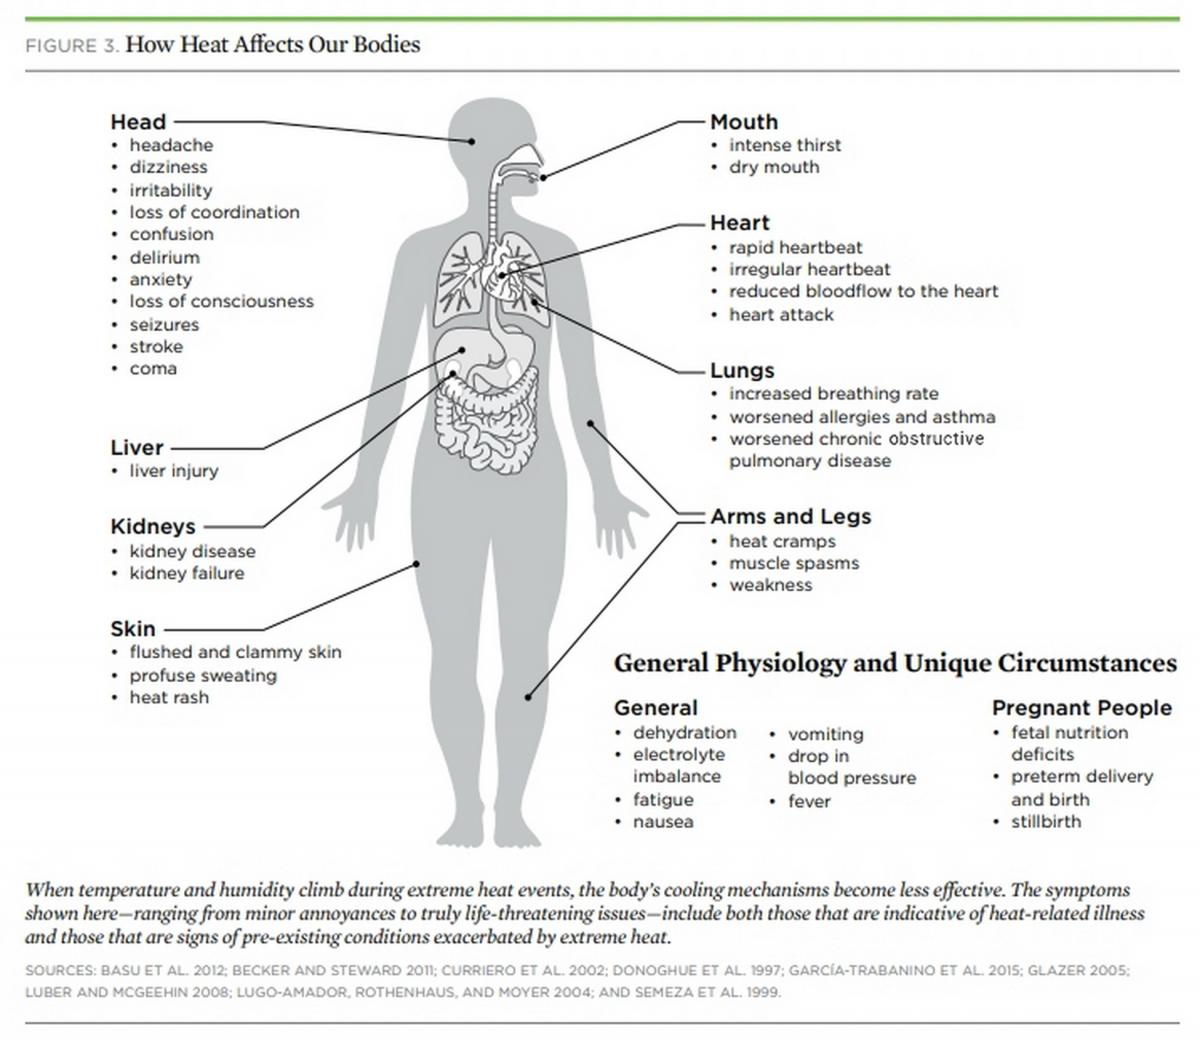
Human impacts from excessive heat
Heat affects humans in a variety of ways, impinging on multiple body systems. As depicted in Figure 3-2, elevated temperatures directly cause heat-related conditions ranging from muscle cramps to heat exhaustion to heat stroke, the latter of which is deadly if not treated promptly (Becker and Stewart 2011; Epstein and Yanovich 2019). In addition, elevated temperatures have been associated with increases in respiratory disease (Anderson et al. 2013; Ho et al. 2015); heart disease and strokes (Knowlton et al. 2009; Wang et al. 2016; Achebak et al. 2018); and fluid and electrolyte disorders, kidney disease, and kidney failure (Bobb et al. 2014; Ross et al. 2018; Sorensen and Garcia-Trabanino 2019). A study by Li et al. (2012) found evidence of a potential high-temperature threshold for several age groups (15–64 yr, 75–84 yr, and >85 yr) and specific heat-related causes for hospital admissions that included endocrine, genitourinary, and renal morbidities, as well as accidental injuries and intentional self-harm.
Elevated temperatures are also associated with increased risk of preterm labor (Auger et al. 2014; Ha et al. 2016; Avalos et al. 2017), as well as sudden infant death/sudden unexpected infant death syndromes (SIDS/SUID) (Jhun et al. 2017). Elevated temperatures also cause worsening mental health, as described in the Mental Health subsection later in Section 3.
The severity and duration of high temperatures influence the health impacts resulting from extreme heat. In addition, air pollution and population vulnerability (Basu 2009) compound these impacts. Vulnerability is also a function of the typical temperatures to which a population is exposed, plus the extent to which a population adapts (Curriero et al. 2002; Baccini et al. 2008; Ho et al. 2015).
Workers, especially those who work outdoors or in hot indoor environments, are at increased risk of heat stress and other heat-related disorders, occupational injuries, and reduced productivity at work (Levy and Roelofs 2019). Workers in the agricultural sector face increased risk of heat strain and dehydration[2] due to repeated exposures to high air temperatures, arduous physical exertion, and limited fluid intake. These risk factors may result in acute kidney injury (Moyce et al. 2017), as well as increased heat-related traumatic injuries (Spector et al. 2016). Spector et al. (2016) suggest that efforts should be made to address heat-related illness and prevent occupational injury for high-risk populations exposed to high temperatures and high physical exertion.
The impacts of increased air temperature may increase workers’ exposure to hazardous chemicals and, thus, the adverse health effects of those chemicals (Spector et al. 2016). Global warming is also increasing ground-level ozone concentrations with adverse effects on outdoor workers (Levy and Roelofs 2019).
Assessing heat impacts specific to Montana
Multiple studies—covering wide ranges of temperature, time, and geographic area—have sought to assess the health impacts of extreme heat (e.g., Morabito et al. 2014; Zhang et al. 2014). Some studies estimate how heat-related mortality differs between rural and urban landscapes (reviewed by Ho et al. 2015). Other studies develop indices to identify heat-vulnerable populations (Vescovi et al. 2005; Reid et al. 2009; Reid et al. 2012; Chuang and Gober 2015).
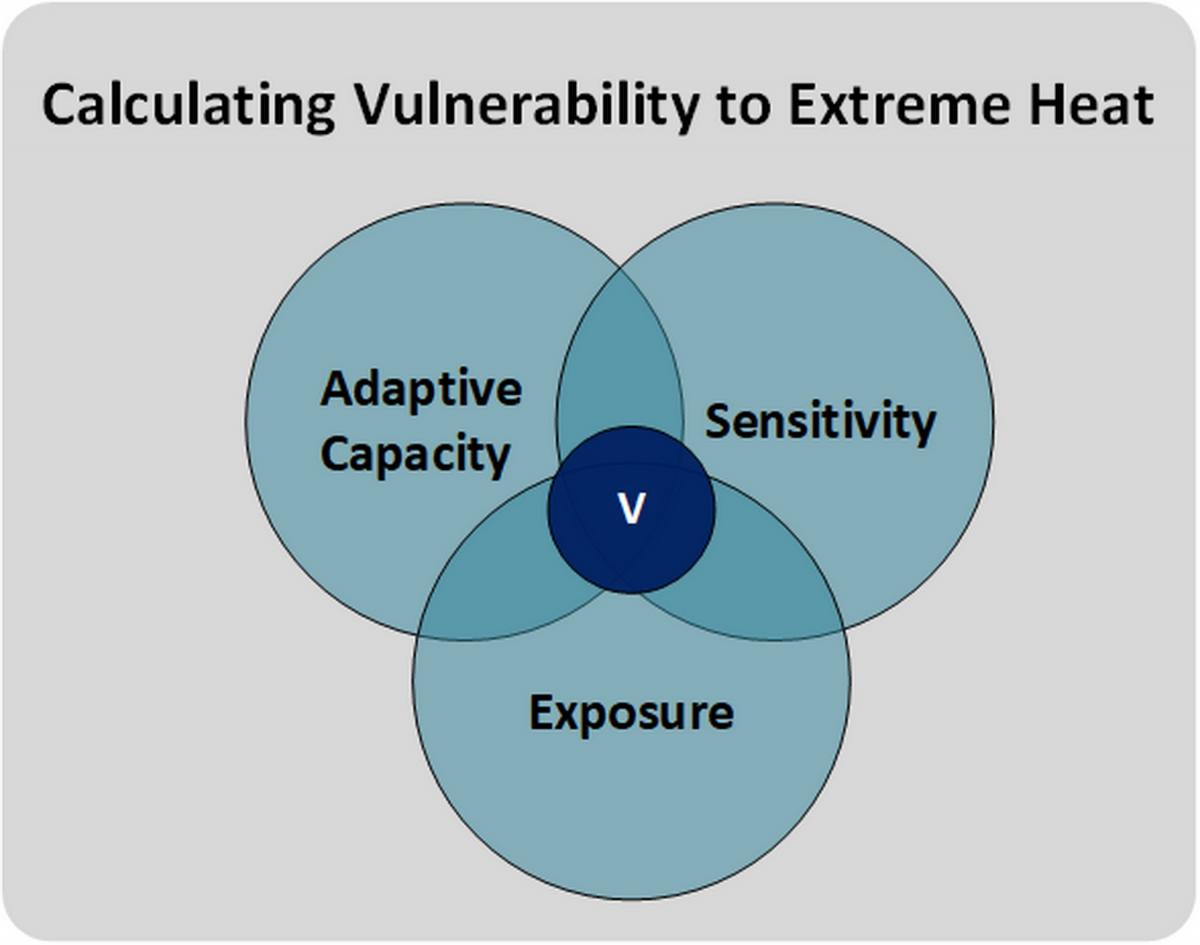
Human health vulnerability to heat is most often expressed as a combination of three factors: adaptive capacity, exposure to heat, and sensitivity to heat (Smit and Wandel 2006; Füssel 2010; Inostroza et al. 2016) (see sidebar). In our analysis, heat vulnerability was calculated as a combination of a) the historical land-surface temperature and future projections of heat to describe exposure; and b) county-level[3] socioeconomic factors to describe sensitivity and adaptive capacity (see Appendix A for details). We will refer to the climate impacts as exposure, and the socioeconomic factors as sensitivity, with sensitivity inclusive of adaptive capacity, but no health factors were directly included due to incomplete county health factor data.
Factors Considered in Determining Vulnerability to Extreme Heat
Vulnerability, in the present context, is the extent to which a person is susceptible to the impacts of climate change. As described in the text and below, many factors go into calculating a person’s vulnerability to extreme heat. Three key terms bear definition:
- adaptive capacity.—The ability of a person (or society) to cope with climate change.
- exposure.—The type and magnitude of a climate change.
- sensitivity.—How easily affected a person is by climate change.
Vulnerability (the “V” in the diagram below) is assumed to be the intersection of adaptive capacity, exposure, and sensitivity (Smit and Wandel 2006; Füssel 2010; Inostroza et al. 2016). We combine adaptive capacity and sensitivity into one group, which is based on socioeconomic factors (see Appendix A for details). We continue to use the intersection of the three areas to determine vulnerability; and assume adaptive capacity is simply implicit in the socioeconomic layers that comprise our sensitivity factor.
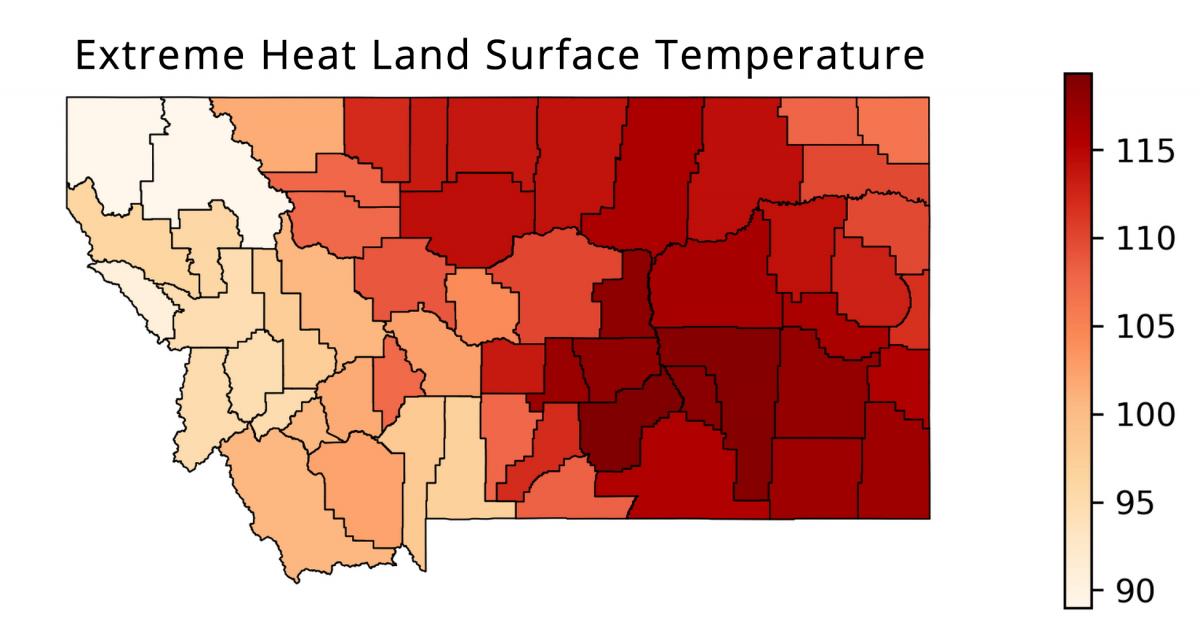
Heat exposure
Heat exposure is modeled as the combination of historical land-surface temperatures and projected heat. To determine the county average land-surface temperature on days of extreme heat, we use the 95th percentile of daily average land-surface temperatures from 2000-2019 (Figure 3-3). For future projected heat, we use the heat index of each county (UCS 2019) generated from an ensemble of general circulation models.[4] The heat index includes a combination of temperature and humidity to create a “feels-like” heat rating.
Sensitivity
We base our calculation of sensitivity to heat on socioeconomic variables from the US Census Bureau, 2013-2017 American Community Survey 5-Year Estimates (US Census Bureau undated).[5] Socioeconomic factors include age, the average income for people in the county, the percent of county population under the poverty line, the percent of poverty households with children, the percent of population employed in construction and production (implying predominantly outdoor workers with greatest exposure to heat), the percent of population unemployed, and type of housing (see further details in Appendix A).
Heat vulnerability
Human exposure to heat has been quantified and mapped, although only a few studies have combined socioeconomic sensitivity with heat exposure data to evaluate human vulnerability to the health risks associated with extreme heat (Buscail et al. 2012; Ho et al. 2015). Most studies that examine health vulnerability to heat use aggregate data that matches the spatial units from which sensitivity information is derived by the US Census Bureau (Ho et al. 2015). For example, most socioeconomic factors are measured at the county scale so exposure measurements (i.e., land-surface temperature and change in future heat) must be averaged across a county. Despite this complication, heat vulnerability is a useful measure to relate climate to human health impacts (see further details in Appendix A). Municipalities can use heat vulnerability information to guide heat mitigation interventions, such as establishment of green or reflective roofs, urban parks, and water features (see Section 5).
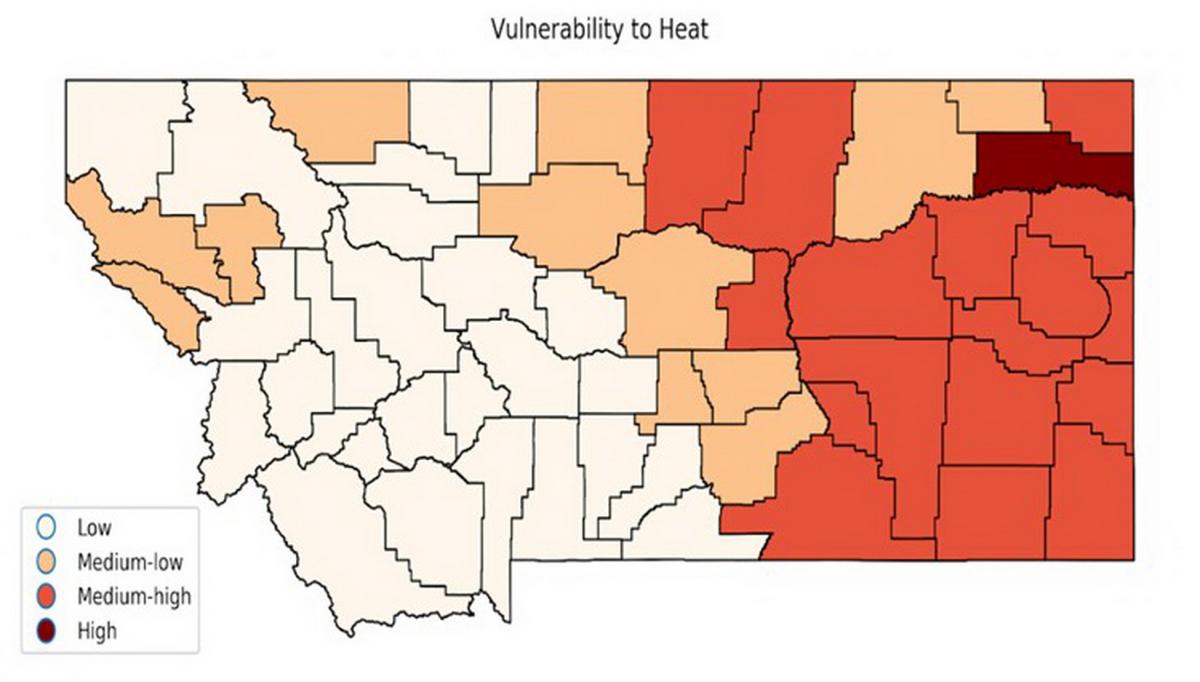
By combining exposure and sensitivity data, we identified counties with populations most vulnerable to extreme temperatures. Vulnerability was split into four main categories represented in Figure 3-4. The darker the color the higher the vulnerability to heat.
Local temperature trends
To understand the local effects of extreme temperatures, we examined daily temperature data from 38 NOAA weather stations across Montana. We determined the maximum and minimum temperature trends in summer months (June, July and August) at each station. The temperature records at individual stations may not coincide or reveal the same patterns as the Montana climate region results indicated in the MCA, which were averaged (Whitlock et al. 2017). Our intent was to examine recent temperatures and their trends at a scale where human health may be monitored and impacted in the future. Our findings are:
- Summer maximum temperature.—Fifteen out of the 38 stations across Montana indicate an increasing trend in summer (June, July, August) maximum temperatures over the last 30 yr. The easternmost stations show no trend in maximum temperatures. No stations have a negative trend in maximum summer temperatures (i.e., cooling) over the last 30 yr (1990-2019).
- Summer minimum temperature.—From 1990-2019 minimum summer night temperature has an increasing trend at 15 of the 38 stations across Montana, and a decreasing trend at four stations. All of the decreasing trends in summer night temperature (i.e., cooling) are in western Montana. Five of the 15 stations with increasing summer maximum temperature also show increasing trends in summer night temperature; three are in urban centers. In other words, stations that show a trend towards increasing temperature during the day also experience a trend towards warming night conditions. Warm nights represent a burden on the human thermoregulatory system, particularly for the elderly and those who rely on natural ventilation (e.g., open windows) to reduce body temperature (Mills et al. 2015).
The number of continuous days and nights at high temperature results in cumulative, negative heat impacts on people. In a study that looked at large cities at sea level, human mortality increased when extremely hot nights followed hot days (Xu and Tong 2017). While a different scenario than faced by Montanans, increased human mortality has the potential to become a concern here given projected increased extreme temperatures.
- Winter minimum temperature.—Winter (December, January, February) minimum temperatures indicate an increasing trend (i.e., winter progressively getting warmer) at only two of 38 stations, both in southwestern Montana, and four stations indicate decreasing trends in winter minimum temperature from 1990-2019. Over the longer period of 1970-2019 (50 yr), 11 out of 35 stations show winters warming while no stations indicate decreasing winter temperature. Thus, the time span for analysis influences the trend, as do the months included in a season. For example, when winter is expanded to include November and March in a different study (not published), 13 out of 15 weather stations show winters getting warmer.
Increasing temperature trends over the last 30 yr at individual weather stations are not limited to the larger cities in Montana where heat islands[6] might exist. Small rural towns are also vulnerable to increasing heat and, based on limited healthcare facilities and other factors (see Section 4), may include citizens who are already vulnerable to extreme conditions. The number of summer days with maximum temperatures over 90oF (32oC) is projected to increase 11-33 days by mid century (Whitlock et al. 2017).
Air Quality Issues
Overview
Degraded air quality, or air pollution, refers to myriad substances, both human-made and naturally occurring, including tobacco smoke, carbon dioxide, nitrous oxides, sulfur dioxide, particulate matter, ground-level ozone, and volatile organic compounds. Outdoor air pollution, some forms of which are also global warming gases, is estimated to contribute to 64,200 premature deaths in the US annually (Watts et al. 2019). Outdoor air pollution is expected to worsen with climate change (Orru et al. 2014).
Across the US, human health concerns related to air quality are dominated by particulate matter and ground-level ozone (American Lung Association undated; Ward and Smith 2001; Tao et al. 2005).
Particulate matter (PM)—especially PM2.5 and PM10, describing particulates under 2.5 μm and 10 μm diameter, respectively—has been associated with multiple health effects. Those effects include cardiovascular, respiratory, and immunological problems, the latter manifesting as increased risk for pneumonia (Rappold et al. 2011; Reid et al. 2016b; Tinling et al. 2016), and neurological issues, in the form of greater risk for dementia (reviewed by Peters et al. 2019). Particulate matter has been found to penetrate the blood-brain barrier—i.e., move into the human brain—and cross the placenta in pregnant women (Bové et al. 2019). It has also been associated with possible increased risk of preterm birth (DeFranco et al. 2016; Trasande et al. 2016), low birth weight (Fleischer et al. 2014), and increased medication use in children with asthma (Gielen et al. 1997).
Ground-level ozone forms when sunlight and heat act on nitrous oxides and volatile organic compounds (Rani et al. 2011). It has been associated with asthma exacerbations, increased hospitalizations, and premature mortality (Bell et al. 2004; Zanobetti and Schwartz 2008; Di et al. 2017), as well as with preterm birth (Olsson et al. 2013). Ground-level ozone is expected to increase with warming temperatures (Melillo et al. 2014).
In Montana, ozone levels are generally rated low (<50) on the USEPA air quality index (AQI), but particulate matter levels are seasonally elevated (>100 AQI) in some areas (AirNow undated).[7] Ten counties in Montana, for example, received grades of “F” for particulate matter in the American Lung Association State of the Air 2020 report card (American Lung Association 2020).[8] Some local areas have elevated particulate-matter levels during winter months due to inversion layers and high woodstove usage. In eastern Montana, particulate matter is expected to increase as summer drought increases dust emissions in agricultural areas where land gets tilled for crops (Gage et al. 2016) and tillage is employed as a common summer fallow practice (Cook et al. 2014; Dawson et al. 2014). Wildfires also contribute significantly to high levels of particulate matter, as we discuss in the next subsection.
Separately, but related to air quality concerns, pollen counts in the United States are increasing with projections for doubling by 2040 (Zhang et al. 2015) due to warming temperatures with longer growing seasons (Ziska et al. 2019), and higher atmospheric carbon dioxide levels (Ziska and Caulfield 2000). In addition to worsening seasonal allergies, this increase in pollen poses risks of triggering exacerbations of asthma, which affects 9.1% and 6.8% of Montana adults and children, respectively (MTDPHHS 2013).
Wildfires and wildfire smoke
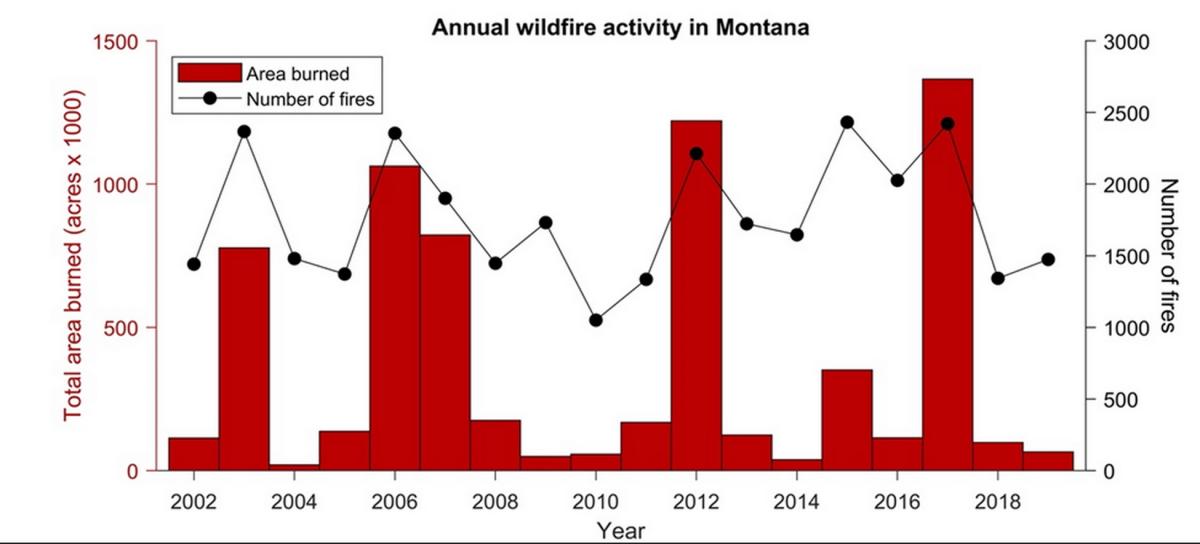
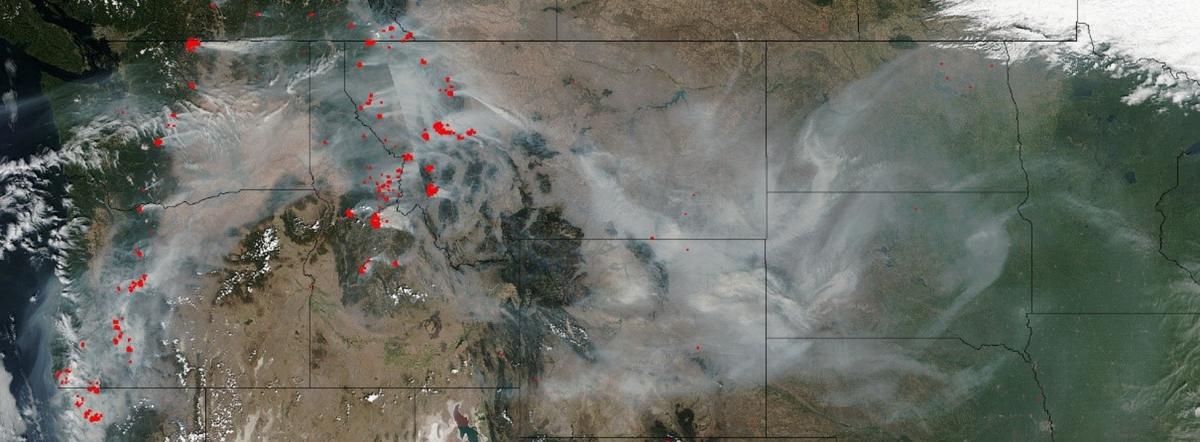
Between 1997 and 2006, 339,000 human deaths per year globally were attributed to smoke from landscape fires, which includes forest fires, peat fires, grass fires, prescribed burns, agricultural burns, and tropical deforestation burning (Johnston et al. 2012). Deaths and injuries occur to people caught in fast-moving fires, as well as to firefighters, emergency response personnel, and others assisting with fire management. Wildfires can result in large-scale, temporary evacuations, or permanent displacement following the destruction of homes or even entire towns (Insurance Information Institute undated). The 2019/2020 fires in Australia, for example, killed 33 people across the country; in New South Wales alone over 2000 homes were destroyed (BBC News 2020). Closer to home, the November 2018 Paradise Fire in California killed 85 people, displaced hundreds, and destroyed over 18,000 buildings (Vox 2019). Large fires with adverse impacts on communities throughout the western US, including Montana, are increasing as measured in numbers of acres burned (Figure 3-6) because a) climate warming produces longer, drier fire seasons and extensive burning; and b) patterns of human development are increasing human exposure to wildfires (Abotzoglou and Williams 2016; Radeloff et al. 2018).
In Montana, increased fire activity in recent decades has impacted people through an increase in hazardous air quality from wildfire smoke, originating locally or from distant sources (see, for example, Figure 3-6). For the western US, including Montana, warmer and drier conditions during summer have contributed to longer fire seasons and more area burned by wildfires, producing more and longer smoke events (Dennison et al. 2014; Westerling 2016; Dalton et al. 2017). Smoke events in the western US from 2004–2009 were associated with a 7.2% increase in respiratory hospital admissions among adults over 65 yr of age (Liu et al. 2017).
Human response data connecting heat and smoke to human health are limited for Montana. In nearby Boise, Idaho, however, seven of the last ten years have included smoke levels considered “unhealthy for sensitive groups” for at least a week during the fire season (IDDEQ 2013), causing cancellation of some school-related sports activities (Nolte et al. 2018). In 2020, large fast-moving fires in California, Colorado, Oregon, and Wyoming resulted in days with the air quality index rated “hazardous” in locations across the western US.
Air quality hazards from wildfire
Wildfire smoke worsens local air quality (Navarro et al. 2016), with substantial public health impacts in regions with large populations near heavily forested areas (Liu et al. 2015; Reid et al. 2016a; Fann et al. 2018). Smoke decreases visibility causing hazardous conditions (Yue et al. 2013), and can be transported hundreds of miles downwind (Dreessen et al. 2016; Kollanus et al. 2016).
Wildfire smoke contains many components that are hazardous to human health, including particulate matter (more below), polyaromatic hydrocarbons, carbon monoxide, nitrous oxide, aldehydes, benzene, among other components (Reisen et al. 2015; Adetona et al. 2016; Liu et al. 2016).
Exposure to wildfire smoke can result in emergency room visits for a variety of conditions, newly caused or aggravated, including asthma and chronic obstructive pulmonary disease (Rappold et al. 2011; Tinling et al. 2016; Cascio 2018); and cardiovascular conditions, including stroke, heart attack, and heart failure (Dennekamp et al. 2015; Haikerwal et al. 2015; Hutchinson et al. 2018; Wettstein et al. 2018). Additionally, wildfires can lead to rapid ozone formation and increased frequency of ozone pollution levels that exceed air quality standards (Jaffe et al. 2008; Jaffe and Widger 2012). Increased ozone pollution harms human health, as described previously.
Particulate matter
Wildfires are estimated to have contributed about 18% of the total atmospheric particulate matter emissions in the US from 2004-2009 (Liu et al. 2015). Wildfires are projected to become the principal driver of summer particulate-matter concentrations in the western US (Ebi et al. 2018).
A study by Liu et al. (2016) shows that on days in the US exceeding regulatory particulate matter (PM2.5) standards, wildfires contributed an average of 71% of total particulate matter (PM2.5). Under future climate change, they estimate that more than 82 million individuals will experience a 57% increase in frequency and a 31% increase in intensity of smoke waves, defined as two or more consecutive days with high, wildfire-associated increases in particulate matter. They additionally project that wildfire-associated particulate matter will increase 160% by mid century under the RCP4.5 scenario (see Section 2).
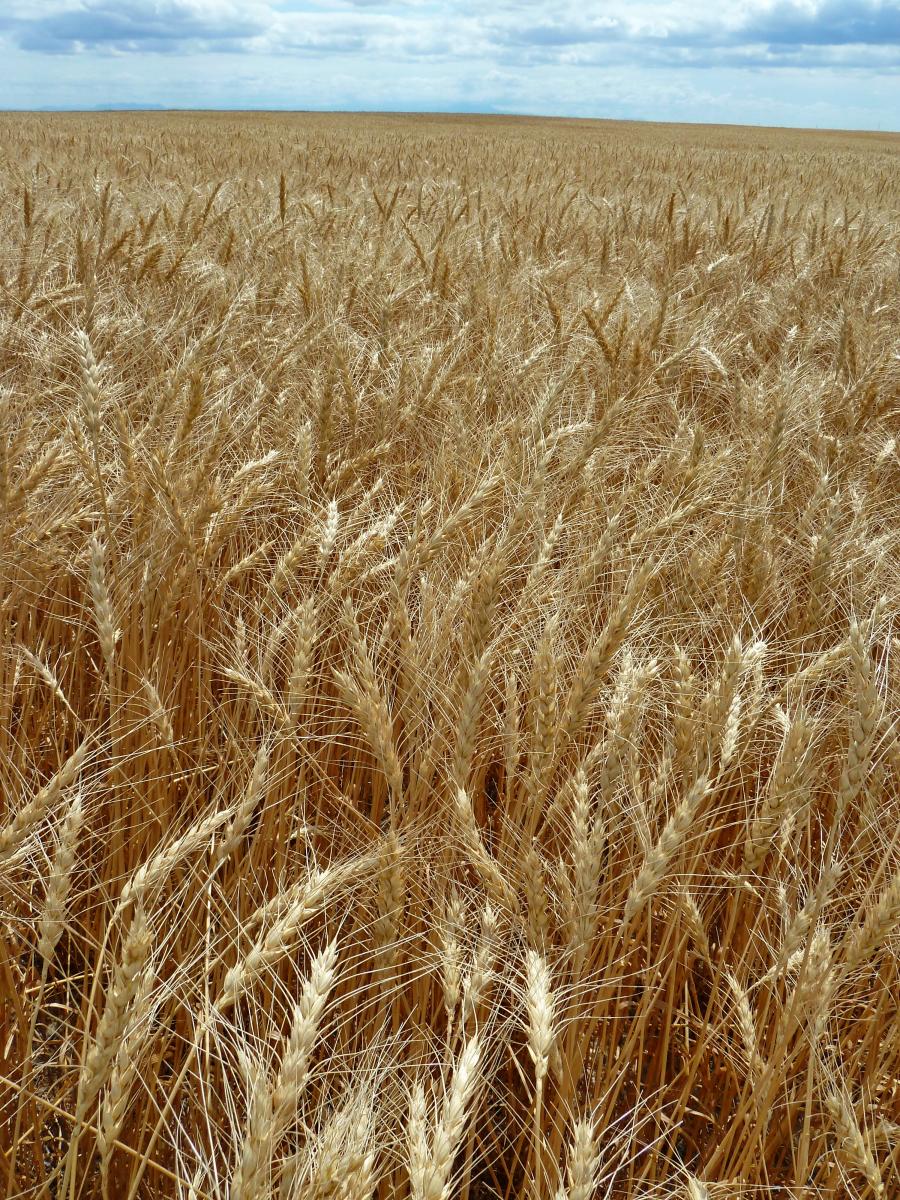
Airborne particulate matter is expected to increase in Montana croplands with more soil-exposed fallow periods (Pi and Sharratt 2017). Wind erosion of soil in wheat production is likely to increase due to increased summer drought and changing precipitation patterns favoring winter wheat over spring wheat. Climate change is also likely to create more cropland abandonment leading to desertification and land degradation (Hughes and Diaz 2008).
Exposure to particulate matter results in numerous negative health outcomes (described above), as well as reduced life expectancy or death (Schwartz et al. 1996; Dominici et al. 2006; Pope et al. 2009; Puett et al. 2009).
New fire projections for Montana
Warmer spring and summer temperatures in Montana and reduced summer precipitation (see Section 2 regarding drought) create conditions conducive to wildfires. In grassland regions, wet spring conditions favor wildfire activity by promoting growth of understory vegetation, which is subsequently flammable during warm, dry summers and even into the fall and following winter (McKenzie and Littell 2017; Holden et al. 2018). When fires ignite under unusually warm, dry conditions—whether caused by humans or lightning—they spread faster, are harder to suppress, and end up burning larger areas than in summers with average climate conditions. Fire danger ratings—a five-class system widely used in wildfire management (low, moderate, high, very high, and extreme)—summarize the ways weather and climate conditions influence the likelihood and spread of wildfires (Dennison et al. 2014).
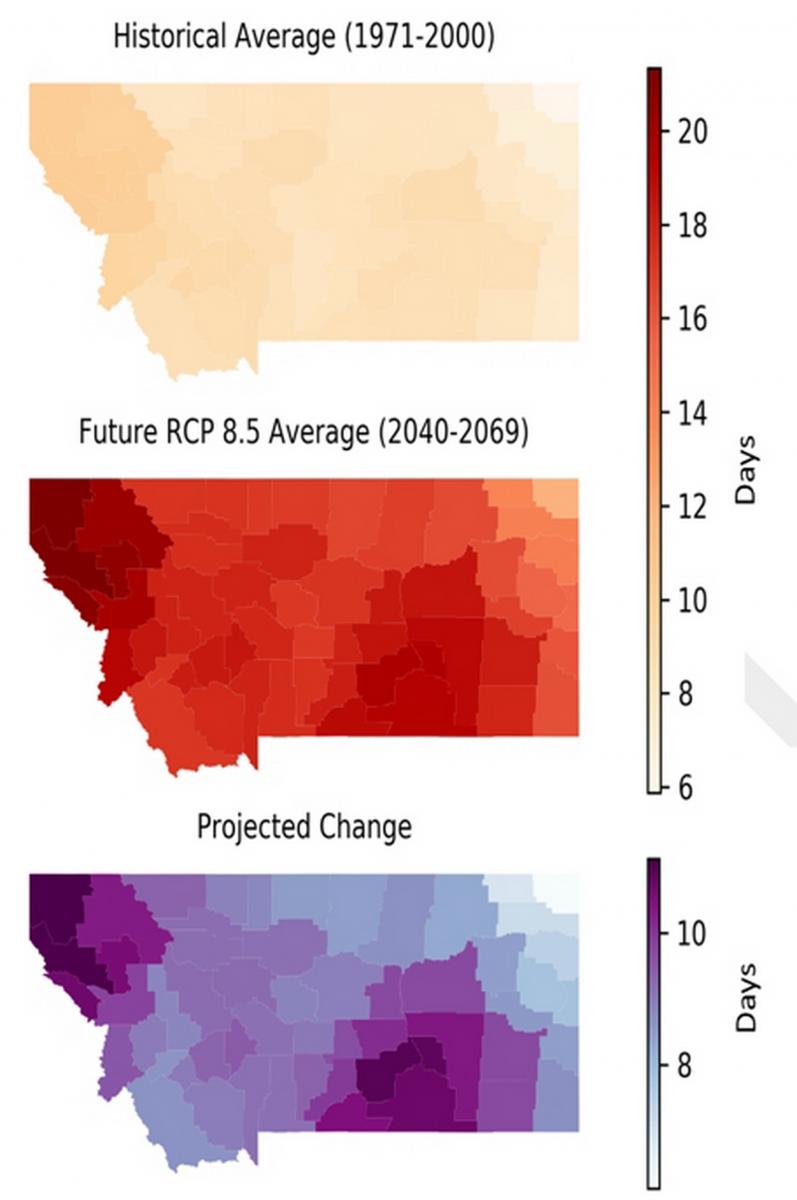
We compare the average number of summer days having extreme fire danger (the highest classification in the system) between a reference period (1971-2000) and mid century (2040-2069), the latter based on climate projections (Whitlock et al. 2017). The most extensive wildfire activity in Montana correlates well with extreme fire danger, and thus the latter provides a suitable representation of extensive wildfire activity and resultant smoke in the future.
Under RCP8.5 climate projections, the number of summer days having extreme fire danger increases across all counties, relative to the 1971-2000 reference period. In many counties, particularly in northwestern and south central Montana, the number of days with extreme fire danger increases by 10 days by mid century, doubling (100% increase) from 1971-2000 benchmark (Figure 3-7). More days with extreme fire danger implies a longer, more active fire season, which ultimately results in more area burned per year, and increased atmospheric particulate matter and smoke (Norby et al. 2010; Jenkins et al. 2014; Jolly et al. 2015). Wildfire smoke is and will be most common in western Montana, primarily because wildfires in forested areas produce large amounts of smoke (Westerling et al. 2006; IDDEQ 2013) (Figure 3-7).
In Montana, Department of Environmental Quality reports show that the number of communities or counties whose air quality rated as moderate, unhealthy, very unhealthy, or hazardous generally increased from 2010-2017 (Figure 3-8), as a result of increased acres burned by wildfires. However, these trends were followed by declining smoke in the below-average fire seasons of 2018 and 2019, but on track in 2020 to be similar to or exceed 2017. The number of smoke events in each health category shows similar trends, with western Montana valleys receiving the most unhealthy smoke days followed by the southeastern region of Montana. In 2017, the most recent year with regionally extensive wildfire activity, Seeley Lake, Lolo, Superior, and Frenchtown all had ten or more days where air quality was rated unhealthy, very unhealthy, or hazardous, with Seeley Lake experiencing 38 days with unhealthy and worse smoke conditions (see Section 2, plus sidebar in Section 4 titled The 2017 Seeley Lake Fires and Lung Function). Assuming that projected increases in extreme fire danger result in increased wildfire activity, Montana could expect an increase in summers exceeding moderate air quality standards, with more communities affected, especially in western Montana.
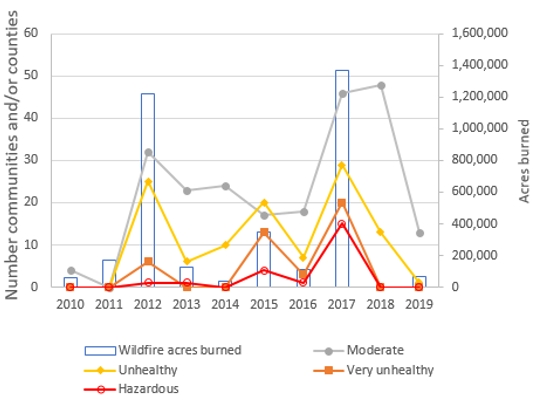
Increased fire danger for Montana in coming decades will likely result in decreased air quality in years with widespread wildfire activity, like 2017. Such years will be interspersed with years having average or below-average fire activity. Communities can adopt a suite of actions to mitigate adverse effects on citizens from poor air quality (McWethy et al. 2019; also, such actions are described in Section 5).
Water-related Illnesses
Climate change is affecting Montana’s water quantity and quality (Whitlock et al. 2017; MTDEQ 2019), each of which may, in turn, impact human health[9]. For example, spring floods, which are expected to increase because of earlier snowmelt or extreme precipitation events (see Section 2), affect people’s health in a variety of ways. Immediate impacts include injury, hypothermia, death from drowning, exposure to toxic substances and pathogens released by flood waters, and exacerbation of underlying conditions such as cardiovascular or pulmonary disease (due the flood itself or cleaning up afterwards). Later complications include respiratory and skin infections, vector-borne illnesses, and mental health conditions (Du et al. 2010; Ryan et al. 2015; Paterson et al. 2018).
Floods also increase the risk of mold formation in homes (Bell et al. 2017), an environmental stressor that can impact anyone but particularly American Indian/Alaska Native children (Barros et al. 2018). Even in the absence of flooding, elevated rates of gastrointestinal disease have been associated with precipitation events (Carlton et al. 2016; Levy et al. 2016), as well as with dry conditions (Alexander et al. 2013; Friedrich 2013; Fouladkhah et al. 2019), though the latter association is weaker.
Water quality issues resulting from climate change may also come about because of changes to precipitation runoff, land use, and the way agricultural lands are managed (MTDEQ undated). Changes to the timing and amount of runoff can impact stream turbidity and sediment deposition, plus non-point pollution runoff and subsequent increased stream concentrations of undesirable compounds. Late season droughts may result in higher concentrations of pollutants—including fertilizers and pesticides—in warmer waters, potentially leading to decreased levels of dissolved oxygen and/or increased algal blooms.
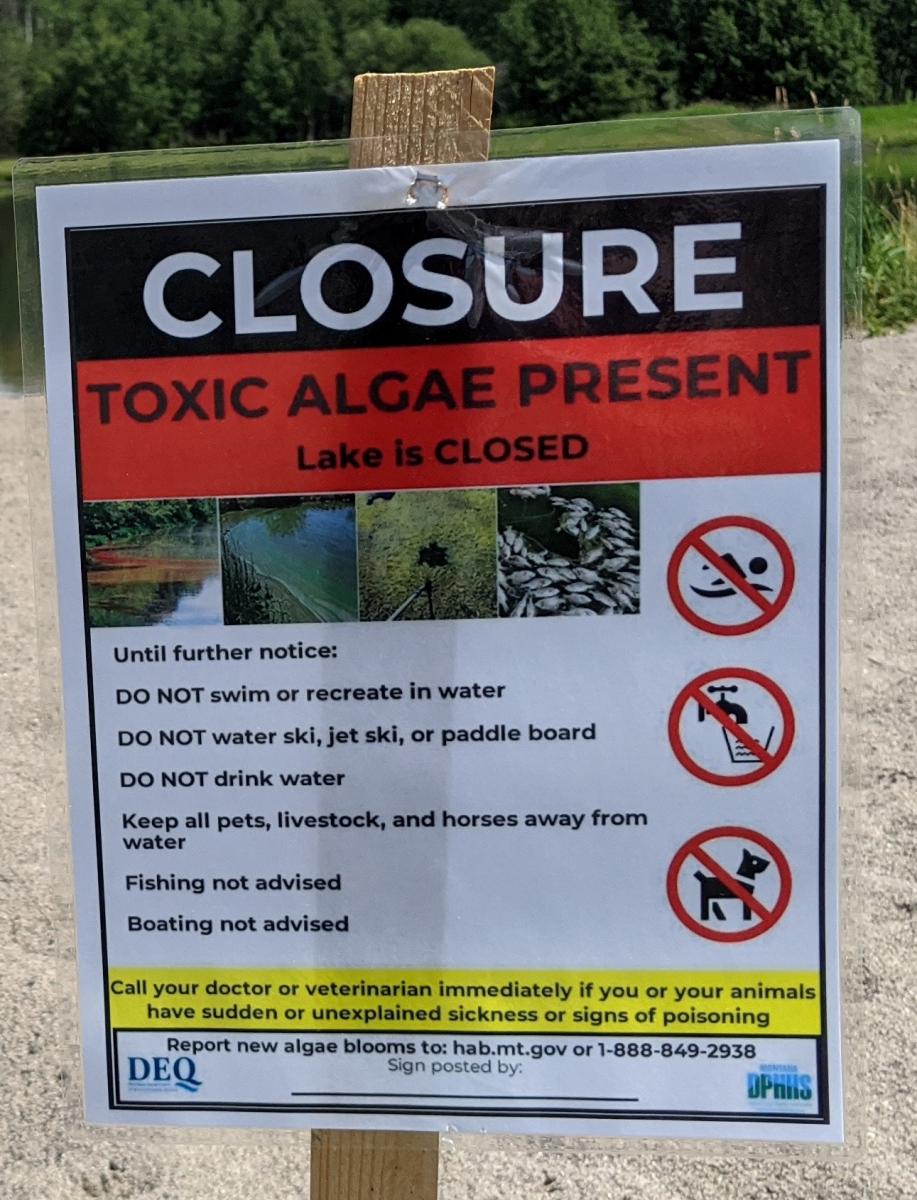
Harmful algal blooms, often caused by cyanobacteria[10], are special cause for concern. Cyanobacteria have increased across the US from under 100 incidents in 2013 to over 500 in 2019 (EWG undated), and are becoming increasingly common in Montana (MTDPHHSa undated). Many factors influence harmful algal blooms, including increased nutrients from agricultural runoff or sewage, changes in water circulation, and increased water temperatures (Paerl and Huisman 2009; Moore et al. 2011; Davidson et al. 2014). Based on climate model projections, Chapra et al. (2017) indicate that concentrations of cyanobacteria are likely to increase across the US, primarily due to water temperature increases and increased nutrient inputs. They predict that the mean number of days of harmful algal bloom occurrence, which is about 7 days/year per water body under current conditions, will increase to 16−23 days in 2050 and 18−39 days in 2090.
Harmful algal blooms can harm human health. Depending on the causative organism and type of exposure, maladies include gastrointestinal symptoms, muscle cramps, skin rashes, liver damage, and even death. In addition, harmful algal blooms can impair municipal water supplies, hamper recreational activity, and cause significant economic hardships (e.g., if tourism declines in the affected areas).
Food Security and Nutrition Concerns
Climate change threatens human health through its effects on agriculture. For Montana, the MCA describes that global warming will influence the distribution of weeds, pathogens, and insect pests and introduce new pests (Whitlock et al. 2017). These changes may alter the types and amount of pesticides used, potentially affecting the health of agricultural workers and others.
In addition, food quantity and quality, including nutrition, are directly and indirectly impacted by climate change (Gowda et al. 2018b) (see sidebar). Grains, for example, provide almost half the calories humans eat and wheat is a major crop in Montana. With increasing atmospheric CO2 levels, plants grow larger and store more carbohydrates (sugars), yet they contain less protein, zinc, iron, and other nutrient concentrations (Myers 2014).[11] Reduced nutrient quality leads to a number of health problems, including:
- Inadequate nutrition can permanently affect the physical and mental development of children. In the US, low iron levels are experienced by one of out of every five children for part of their childhood (Irwin and Jeffrey 2001).
- Low iron levels have been associated with decreased cognitive function (Jáuregui-Lobera 2014), reduced work capacity (Haas and Brownlie 2001), decreased quality of life, and reduced life expectancy (Shander et al. 2014).
- Reduced protein decreases muscle mass.
- Undernourished people have greater difficulty fighting infections.
- Severe zinc deficiency can cause diarrhea, weight loss, skin lesions, and decreased immunity (NCHS undated).
Climate Impacts on Food Availability and Nutrition
Food and nutrition concerns resulting from a warming world could outweigh all other human health impacts brought on by climate change (Springmann et al. 2016). Examples include:
 Elevated CO2 levels can reduce the protein and micronutrient concentration in grains, putting larger swaths of the global population at risk for malnutrition and anemia (Medek et al. 2017; Smith and Myers 2018; Uddling et al. 2018).
- Increased temperatures, both modest and extreme, can lower crop yields (Zhao et al. 2017; Vogel et al. 2019), as can drought (Lesk et al. 2016) and extreme weather events (Nelson et al. 2014).
- Increased food prices are an economic result of lower crop yields, making some foods less available to those who may already be undernourished. Increased food prices disproportionately affect lower income people (Lake et al. 2012).
- Montana has seen longer growing seasons, offset by summers becoming hotter and drier. Hence, it is hard to project whether local food production will increase.
Climate change can also lower the overall quantity of food produced, resulting in multiple impacts including to traditional sources for American Indians (Zhao et al. 2017; Gowda et al. 2018b; see Section 4 sidebar: Changes Rippling Through Our Lives and Waters). The salt content of underground water sources (aquifers) and coastal lands globally is increasing due to greater withdrawal of groundwater and sea-level rise, making these regions less productive or non-productive. Some pests and weeds that lower the productivity of food crops can thrive better in a CO2-enriched atmosphere (Deutsch et al. 2018; Ziska et al. 2019). Increasing extreme weather (e.g., flood and precipitation events), growing season drought, and increasing fire severity can also be a detriment to food production.
Food and nutrition concerns resulting from a warming world could outweigh all other human health impacts brought on by climate change (Springmann et al. 2016).
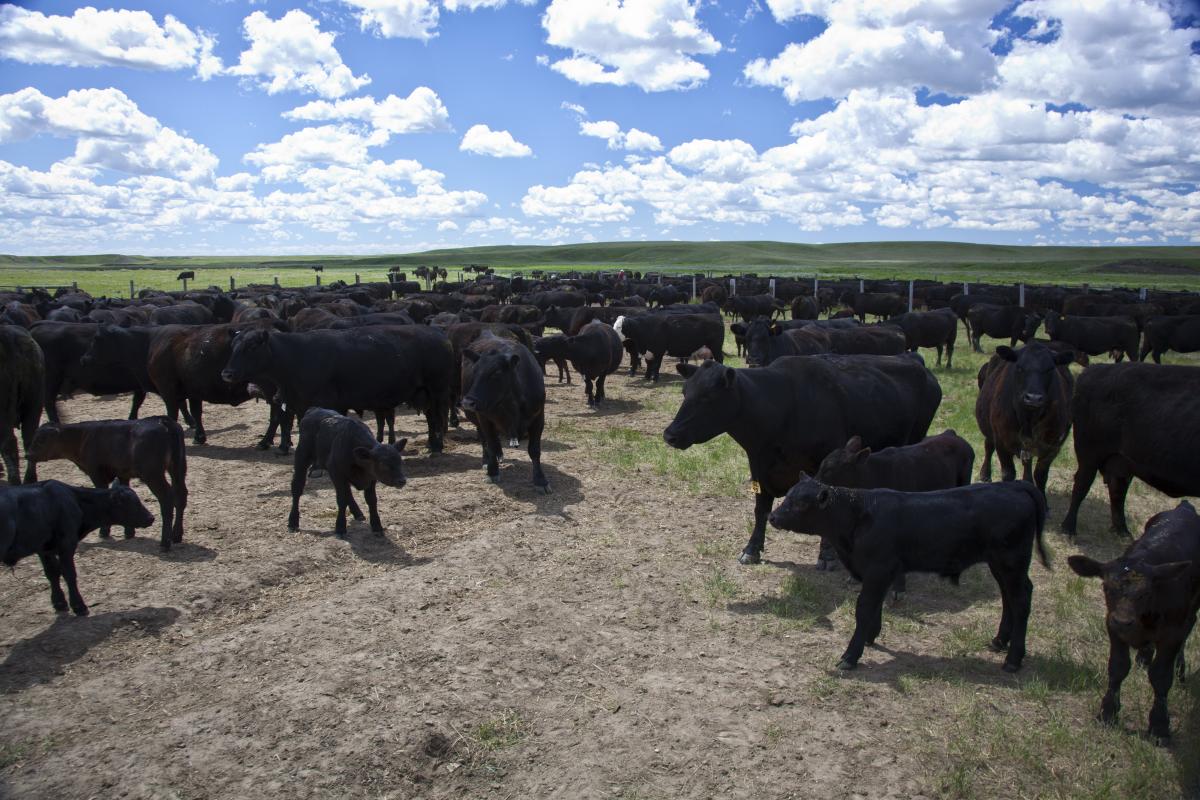
Livestock, not just plants, are impacted by climate change. Milk production decreases as dairy cows are exposed to increased heat (reviewed in Whitlock et al. 2017; Summer et al. 2018). Deaths in all animals, including livestock, increase with excessive heat, and animals with dark coats are more sensitive to extreme heat. Heat waves make livestock less fertile (Takahashi 2012). Extreme weather events, such as flash floods and drought, also lead to increased animal mortality.
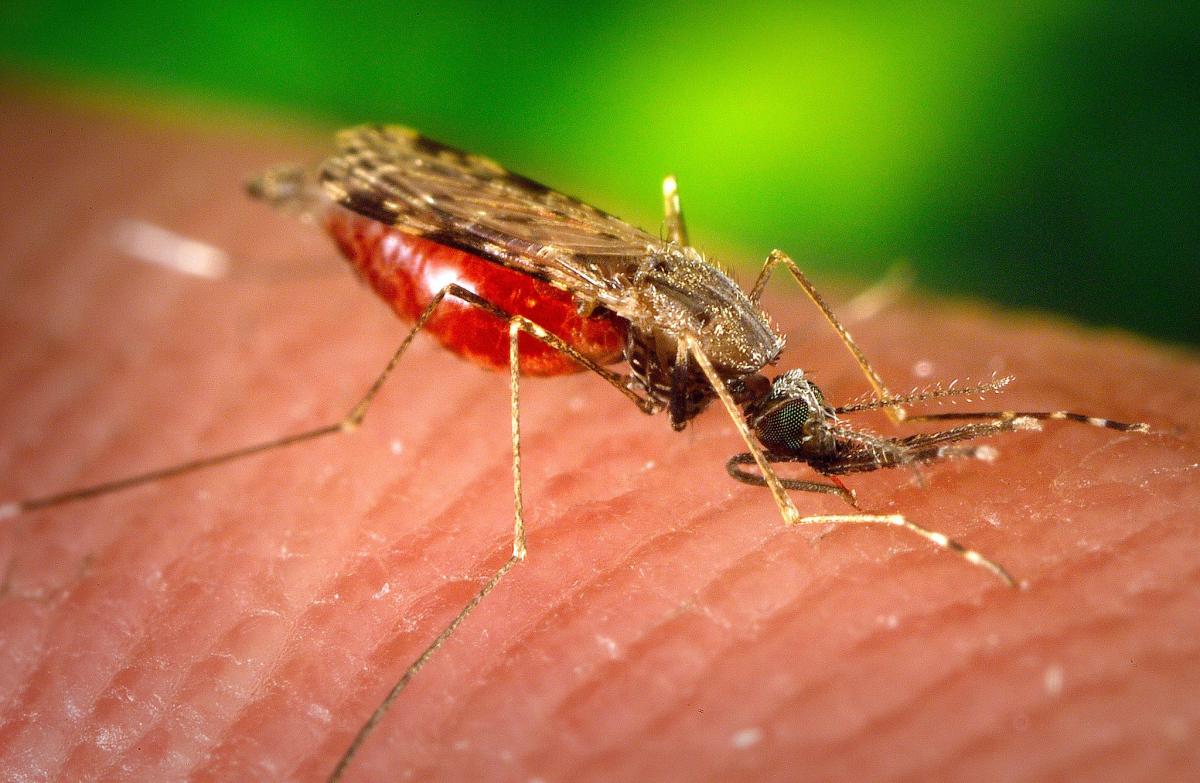
Vector-borne Disease
Vectors—primarily arthropods such as ticks, mosquitoes and fleas—are organisms that transmit diseases from one host to another. Globally, vector-borne diseases include Zika, plague, dengue, malaria, yellow fever, Chagas disease, and Chikungunya, among others. In the US, Rocky Mountain spotted fever, Lyme disease, and anaplasmosis, all carried by ticks, and West Nile virus, transmitted by mosquitoes, are most prominent. Zika, dengue, Chikungunya, and Eastern Equine Encephalitis are also of concern.
Overall, climate change is expected to increase the range of vectors, primarily ticks and mosquitoes in the US, thereby increasing the number of people exposed to the diseases that these arthropods transmit (Beard et al. 2016; Sonenshine 2018). Recent work by Rosenberg et al. (2018) shows that the number of vector-borne diseases tripled in the US between 2004 and 2016, with over 100,000 cases reported in 2016. Whereas the marked increase is unlikely to be fully attributable to climate change given the complexities of vector life cycles, disease prevalence, and human interactions (well discussed by Ogden 2017), neither can the contribution of climate change be discounted. Thus, concern is reasonable.
The interactions between climate, vectors, and pathogens are complex. For example, for certain mosquitoes increased temperatures boost the rate of reproduction and feeding, lengthen the breeding season, and shorten the maturation time for the pathogens they carry (Patz et al. 1996; Epstein et al. 1998; Epstein 2005). However, such complex relationships vary by locale and species. Temperatures that benefit mosquitoes may be detrimental to ticks; flooding may wash away larval stages of mosquitoes; drought may contribute to a decline in tick numbers. Rodent vectors, such as deer mice that carry Hantavirus, demonstrate equally variable relationships (Mordecai et al. 2012, 2017, 2019).
Lyme disease
According to the Centers for Disease Control and Prevention (CDC), Lyme disease is the most common vector-borne illness in the US, with approximately 300,000 total cases diagnosed annually (CDCa undated). Lyme disease is most prevalent in the Northeast, but has been spreading westward and northward into the Midwestern states and farther into Canada. The main vector, the deer or blacklegged tick, is not found in arid parts of the West, requiring more moisture to thrive. Although Lyme disease is the most common tick-borne disease in Montana—averaging 10 cases per year—all cases reported through 2018 came from people infected outside of Montana (MTDPHHSb undated).
West Nile virus
West Nile virus, first reported in the United States in 1999, is found in nearly every country and is the most common mosquito-borne illness in the United States, with 2647 cases and 167 deaths reported in 2018 (CDCb undated). West Nile virus is considered the most important cause of viral encephalitis globally (Chancey et al. 2015; Paz 2015), with increased spread projected with climate change (Paz 2015). Drier weather, especially drought, leads to higher rates of West Nile virus infection in people (Wang et al. 2010; Paull et al. 2016).
In the last several years, the northwest region of the US has seen an increase in some infectious diseases, including West Nile virus. The Washington Department of Health’s vector surveillance program observed earlier arrival of West Nile virus-carrying mosquitoes than some other states (likely associated with higher temperatures), and an increasing number of human infections, including some resulting in fatalities (WSDOH 2018).
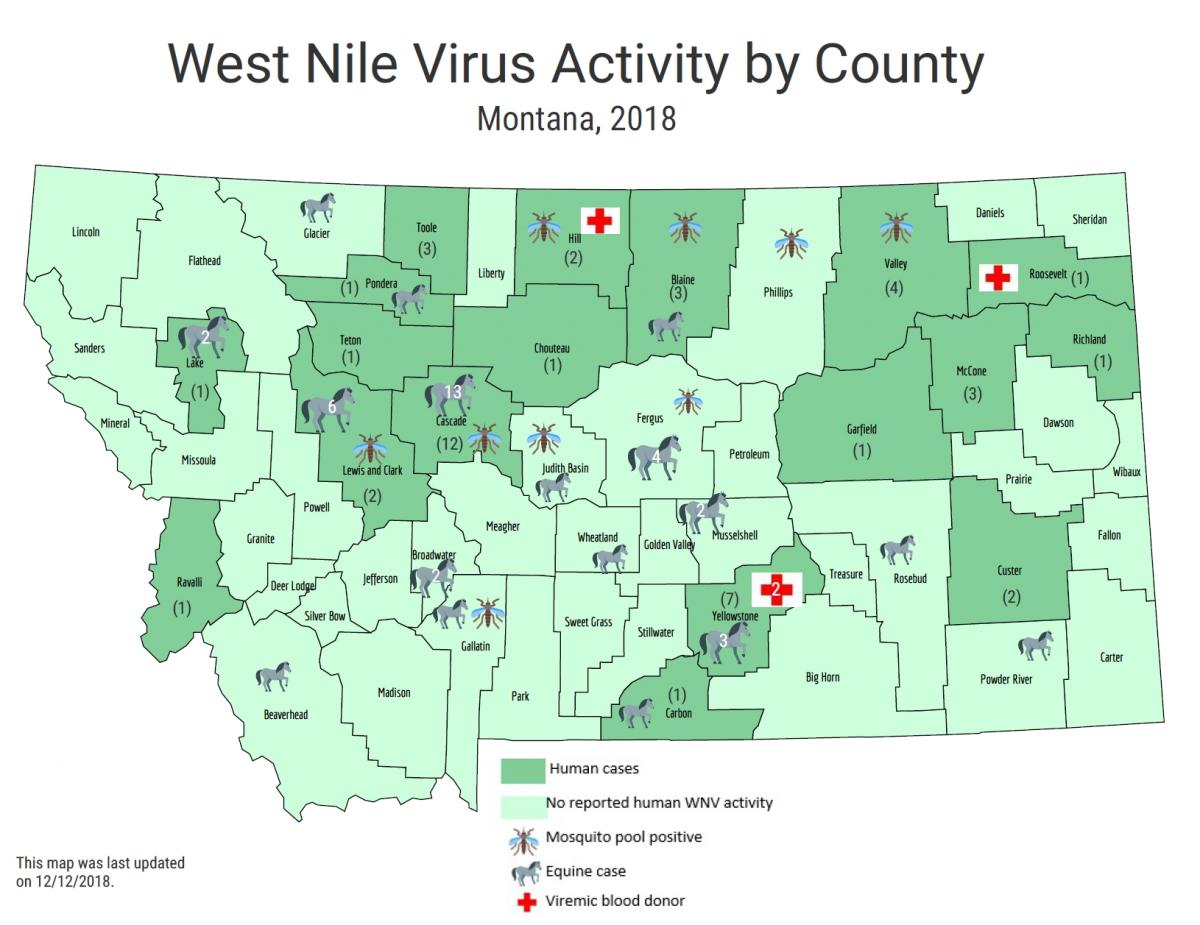
Montana had no cases of West Nile virus until 2002. By 2018, the Montana Department of Public Health and Human Services (MTDPHHS) reported 51 cases across 18 counties. Nine counties reported mosquito pools[12] that tested positive for West Nile virus out of 30 counties tested (Figure 3-9). Three people have died from West Nile virus in Montana since it was first detected (MTDPHHSc undated). MCA projects longer droughts, warmer temperatures, and minimal change in average annual precipitation, likely concentrated in fewer precipitation events (Whitlock et al. 2017; also see Section 2), factors that favor both the virus and the primary vector, the Culex spp. mosquito (Epstein 2001; Harrigan et al. 2014; Paull et al. 2017). Thus, concern exists for climate change resulting in increased numbers of West Nile virus infections in Montana.
Climate Change and Mental Well-being—Perspectives from Montana Farmers and Ranchers
Meredith Howard, Selena Ahmed, Paul Lachapelle, and Mark B. Schure
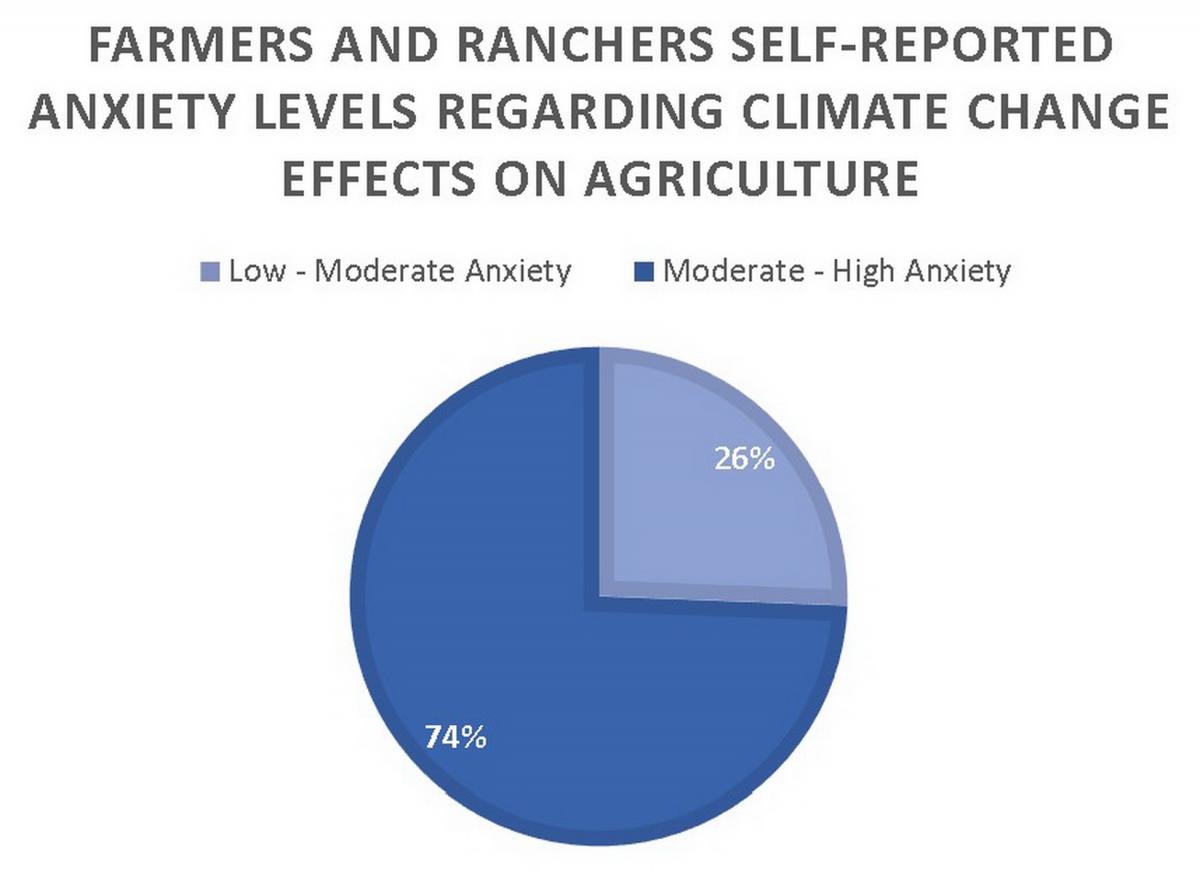
While the physical and economic implications of climate change have been studied widely, including effects on agricultural systems, the mental health implications have been largely overlooked. Farmers and ranchers—who contribute to local, national, and global food security—represent an especially vulnerable and critical population for consideration. Montana State University researchers surveyed farmers and ranchers (n=125) in Montana using a mixed-method approach to investigate the relationship between climate change perceptions and mental well-being (Howard et al. 2020). Survey results revealed the following:
- The majority of respondents (72%) agreed that climate change is having an adverse effect on their farm or ranch.
- Nearly three quarters of respondents reported feeling moderate to high levels of anxiety when thinking about climate effects on their agricultural business.
- The greater the reported perceived risk regarding climate change, the greater the level of reported anxiety.
- The impact of climate change on farm/ranch profitability was perceived as a main cause of distress.
 One Montana producer commented, “[I am] worried about crop losses of current and future years, and about where funds will come for dealing with climate change on the farm. As with most, my worries generally stem from financial stress.”
Another respondent shared, “Climate change contributes to my distress because it makes planning for long-term crops more difficult and predicting weather patterns less predictable.”
Public-health preparedness efforts are warranted to provide mental health support for the agricultural sector. Research and outreach efforts are further called for to promote the adoption of practices that mitigate climate risk and enhance personal and food-system resilience. Linkages between climate-induced anxiety and an increasingly aging and female farm and ranch population should also be studied. Policy discussions at various scales should be considered to address financial risk to agricultural enterprises in the face of increased climate variability.
Mental Health Concerns
The mental health impacts of climate change are profound and varied. Elevated temperatures have been related to worsening a) mental health status (Obradovich et al. 2018); b) diminished cognitive function (Laurent et al. 2018); c) increased violence (Clayton et al. 2017); d) increased interpersonal aggression in the form of domestic violence, abuse, and rapes (Hsiang et al. 2013); and e) suicide (Page et al. 2007). Even small increases in temperature, in one case comparing average monthly temperatures between 25-30°C (77-86°F) with those over 30°C (86°F), can lead to significant increases in mental illness (Obradovich et al. 2018).
People with preexisting mental illness are at increased risk following weather-related events (Trombley et al. 2017), as are youth (Paulson et al. 2015; Orengo-Aguayo et al. 2019). Likewise, climate “surprises” (see Section 2) such as flooding (Lamond et al. 2015), wildfires, or storms have been shown to impact mental health. Those impacts include increases in post-traumatic stress disorder (PTSD), anxiety, depression, substance abuse, and suicidal thoughts. A sense of community loss and, in many cases, displacement can also result following sudden extreme events, or they may occur over time with slower, sustained climate change impacts (e.g., persistent drought or sea-level rise) (Hayes et al. 2018; Palinkas and Wong 2019).
Montana has one of the highest per capita suicide rates in the country (CDC 2018; AAS 2020a,b). This unfortunate reality, coupled with limited access to mental health professionals in most rural areas of the state, greatly heightens the importance of preparedness planning in Montana to address anxiety, stress, and other mental health issues exacerbated by climate change.
Montana has one of the highest per capita suicide rates in the country (CDC 2018; AAS 2020a,b), discussed in detail in Section 4. This unfortunate reality, coupled with limited access to mental health professionals in most rural areas of the state, greatly heightens the importance of preparedness planning in Montana to address anxiety, stress, and other mental health issues exacerbated by climate change (see sidebar). The Montana health workforce does not have widely available access to training on how to address climate anxiety and post-disaster trauma; nor does it have information on the tracking of climate stressors (Doppelt 2016).
[1] Montanans could feel indirect influences of sea-level rise, for example if coastal populations are forced to relocate inland or coastal grain export terminals important to the Montana economy must be moved.
[2] Dehydration, or the excessive loss of body water, can have many causes, including heat exposure, kidney disease, and diseases of the gastrointestinal tract that cause vomiting or diarrhea.
[3] Figure 2-1 provides a map showing and naming Montana’s 56 counties.
[4] Both heat index and general circulation models are described in Section 2.
[5] See Appendix A for a complete explanation of socioeconomic variables and their weighting to derive a heat vulnerability index.
[6] According to the US Environmental Protection Agency (USEPA undated): “Heat islands occur on the surface and in the atmosphere. On a hot, sunny summer day, the sun can heat dry, exposed urban surfaces, such as roofs and pavement, to temperatures 50–90°F (27–50°C) hotter than the air, while shaded or moist surfaces—often in more rural surroundings—remain close to air temperatures. Surface urban heat islands are typically present day and night, but tend to be strongest during the day when the sun is shining.”
[7] The USEPA developed the AQI scale as a simple way to convey how clean or polluted air is. The AQI scale has six levels: 0-50 good; 51-100 Moderate; 101-150 Unhealthy for sensitive groups; 151-200 Unhealthy; 201-300 Very unhealthy; 301-500 Hazardous.
[8] The report is based on data collected from 2016-2018. The ten Montana counties are Fergus, Flathead, Gallatin, Lewis and Clark, Lincoln, Missoula, Powder River, Ravalli, Rosebud, and Silver Bow.
[9] Ecological health may also be impacted, but here we focus on human health.
[10] Although commonly referred to as blue-green algae, cyanobacteria are a group of photosynthetic bacteria.
[11] Conversely, in some cases drought can increase the concentration of nutrients (Balla et al. 2011; Gooding et al. 2008).
[12] A mosquito pool is described by the West Umatilla Mosquito Control District as a collection of mosquitoes (usually about 50) of any given species or group (e.g., Culex spp. mosquitoes) that are likely to carry and potentially transmit a virus (WUMCD undated).
Literature Cited
[AAS] American Association of Suicidology. 2020a. Annual ranking of USA states by crude suicide rates (rates per 100,000 population), 1990-2018 [report]. Available online https://suicidology.org/wp-content/uploads/2020/02/StateRankings1990to20.... Accessed 28 Apr 2020.
[AAS] American Association of Suicidology. 2020b. USA suicide: 2018 official final data [report]. Available online https://suicidology.org/wp-content/uploads/2020/02/2018datapgsv2_Final.pdf. Accessed 24 Apr 2020.
Achebak H, Devolder D, Ballester J. 2018. Heat-related mortality trends under recent climate warming in Spain: a 36-year observational study. PLOS Medicine 15(7):e1002617. doi:10.1371/journal.pmed.1002617.
Adetona O, Reinhardt TE, Domitrovich J, Broyles G, Adetona AM, Kleinman MT, Ottmar RD, Naeher LP. 2016. Review of the health effects of wildland fire smoke on wildland firefighters and the public. Inhalation Toxicology 28(3): 95-139.
AirNow [undated]. AQI calculations overview—ozone, PM2.5, and PM10 [website]. Available online https://forum.airnowtech.org/t/aqi-calculations-overview-ozone-pm2-5-and.... Accessed 27 Apr 2020.
Alexander KA, Carzolio M, Goodin D, Vance E. 2013. Climate change is likely to worsen the public health threat of diarrheal disease in Botswana. International Journal of Environmental Research and Public Health 10(4):1202–30. doi:10.3390/ijerph10041202.
American Lung Association. [undated]. State of the air: health effects of ozone and particle pollution [website]. Available online http://www.stateoftheair.org/health-risks/. Accessed 27 Apr 2020.
American Lung Association. 2020. State of the air 2020: report card Montana [website]. Available online http://www.stateoftheair.org/city-rankings/states/montana/. Accessed 28 Apr 2020.
Anderson BG, Dominici F, Wang Y, McCormack MC, Bell ML, Peng RD. 2013. Heat-related emergency hospitalizations for respiratory diseases in the Medicare population. American Journal of Respiratory and Critical Care Medicine 187(10):1098–103. doi:10.1164/rccm.201211-1969oc.
Auger N, Naimi AI, Smargiassi A, Lo E, Kosatsky T. 2014. Extreme heat and risk of early delivery among preterm and term pregnancies. Epidemiology 25(3):344–50. doi:10.1097/EDE.0000000000000074.
Avalos LA, Chen H, Li D-K, Basu R. 2017. The impact of high apparent temperature on spontaneous preterm delivery: a case-crossover study. Environmental Health 16(1):5. doi:10.1186/s12940-017-0209-5.
Baccini M, Biggeri A, Accetta G, Kosatsky T, Katsouyanni K, Analitis A, Anderson HR, Bisanti L, D’Ippoliti D, Danova J. 2008. Heat effects on mortality in 15 European cities. Epidemiology 19:711-9.
Balla K, Rakszegi M, Li Z, Békés F, Bencze S, Veisz O. 2011. Quality of winter wheat in relation to heat and drought shock after anthesis. Czech Journal of Food Sciences 29(2):117–28. doi:10.17221/227/2010-cjfs.
Barbero R, Abatzoglou JT, Steel EA, Larkin NK. 2014. Modeling very large-fire occurrences over the continental United States from weather and climate forcing. Environmental Research Letters 9(12):124009. http://dx.doi.org/10.1088/1748-9326/9/12/124009.
Barros N, Tulve NS, Heggem DT, Bailey K. 2018. Review of built and natural environment stressors impacting American-Indian/Alaska-Native children. Reviews on Environmental Health. 33(4):349–81. doi:10.1515/reveh-2018-0034.
Basu R. 2009. High ambient temperature and mortality: a review of epidemiologic studies from 2001 to 2008. Environmental Health 8:40. doi:10.1186/1476-069X-8-40.
[BBC News] British Broadcasting Corporation 2020 (31 Jan). Australia fires: a visual guide to the bushfire crisis [article]. Available online https://www.bbc.com/news/world-australia-50951043. Accessed 24 Apr 2020.
Beard CB, Eisen RJ, Barker CM, Garofalo JF, Hahn M, Hayden M, Monaghan AJ, Ogden NH, Schramm PJ. 2016. Vector-borne diseases [chapter 5]. In: Crimmins A, Balbus J, Gamble JL, Beard CB, Bell JE, Dodgen D, Eisen RJ, Fann N, Hawkins MD, Herring SC, Jantarasami L, Mills DM, Saha S, Sarofim MC, Trtanj J, Ziska L (eds). The impacts of climate change on human health in the United States: a scientific assessment. Washington DC: US Global Change Research Program. p 129-156. Available online https://s3.amazonaws.com/climatehealth2016/low/ClimateHealth2016_05_Vect.... Accessed 3 Mar 2020.
Becker JA, Stewart LK. 2011. Heat-related illness. American Family Physician 83(11):1325–30.
Bell JE, Brown C, Conlon K, Herring S, Kunkel KE, Lawrimore J, Luber G, Schreck C, Smith A, Uejio C. 2017. Changes in extreme events and the potential impacts on human health. Journal of the Air and Waste Management Association 68(4):265–87. doi:10.1080/10962247.2017.1401017.
Bell ML, MacDermott A, Zeger SL, Samet JM, Dominici F. 2004. Ozone and short-term mortality in 95 US urban communities, 1987-2000. Journal of the American Medical Association 292(19):2372–8. doi:10.1001/jama.292.19.2372.
Berko J, Ingram DD, Saha S, Parker JD. 2014. Deaths attributed to heat, cold, and other weather events in the United States, 2006-2010. National Health Statistics Report July 30(76):1-15.
Bobb JF, Obermeyer Z, Wang Y, Dominici F. 2014. Cause-specific risk of hospital admission related to extreme heat in older adults. Journal of the American Medical Association 312(24):2659–67. doi:10.1001/jama.2014.15715.
Bové H, Bongaerts E, Slenders E, Bijnens EM, Saenen ND, Gyselaers W, Eyken P, Plusquin M, Roeffaers MB, Ameloot M, Nawrot TS. 2019. Ambient black carbon particles reach the fetal side of human placenta. Nature Communications 10(1):3866. doi:10.1038/s41467-019-11654-3.
Buscail CE, Upegui E, Viel J-F. 2012. Mapping heatwave health risk at the community level for public health action. International Journal of Health Geographics 11(38). https://doi.org/10.1186/1476-072X-11-38.
Carlton EJ, Woster AP, DeWitt P, Goldstein RS, Levy K. 2016. A systematic review and meta-analysis of ambient temperature and diarrhoeal diseases. International Journal of Epidemiology 45(1):117–30. doi:10.1093/ije/dyv296.
Cascio WE. 2018. Wildland fire smoke and human health. Science of the Total Environment 624:586-95. http://dx.doi.org/10.1016/j.scitoenv.2017.12.086.
[CDCa] Centers for Disease Control and Prevention. [undated]. How many people get Lyme disease? [website]. Available https://www.cdc.gov/lyme/stats/humancases.html. Accessed 3 Mar 2020.
[CDCb] Centers for Disease Control and Prevention. [undated]. West Nile virus disease cases and presumptive viremic blood donors by state—United States, 2018 [report]. 2 p. Available online https://www.cdc.gov/westnile/resources/pdfs/data/WNV-Disease-Cases-PVDs-.... Accessed 3 Mar 2020.
[CDC] Centers for Disease Control and Prevention. 2018. National Center for Health Statistics: suicide mortality by state [website]. Available online https://www.cdc.gov/nchs/pressroom/sosmap/suicide-mortality/suicide.htm. Accessed 26 Mar 2020.
Chancey C, Grinev A, Volkova E, Rios M. 2015. The global ecology and epidemiology of West Nile virus. Biomedical Research International 2015:376230. doi:10.1155/2015/376230.
Chapra SC, Boehlert B, Fant C, Bierman Jr VJ, Henderson J, Mills D, Mas DML, Rennels L, Jantarasami L, Martinich J, Strzepek KM, Paerl HW. 2017. Climate change impacts on harmful algal blooms in US freshwaters: a screening-level assessment. Environmental Science and Technology 51(16):8933-43.
Chuang WC, Gober P. 2015. Predicting hospitalization for heat-related illness at the census tract level: accuracy of a generic heat vulnerability index in Phoenix, Arizona (USA). Environmental Health Perspectives 123(6):606–12. doi:10.1289/ehp.1307868
Clayton S, Manning C, Krygsman K, Speiser M. 2017. Mental health and our changing climate: impacts, implications, and guidance [report]. Washington, D.C.: American Psychological Association, and ecoAmerica. 70 p. Available online https://www.apa.org/news/press/releases/2017/03/mental-health-climate.pdf. Accessed 22 May 2020.
Cook BI, Smerdon JE, Seager R, Coats S. 2014. Global warming and 21st century drying. Climate Dynamics 43(9):2607-27. http://dx.doi.org/10.1007/s00382-014-2075-7
Curriero FC, Heiner KS, Samet JM, Zeger SL, Strug L, Patz JA. 2002. Temperature and mortality in 11 cities of the eastern United States. American Journal of Epidemiology 155:80-7.
Dalton MM, Dello KD, Hawkins L, Mote PW, Rupp DE. 2017. Third Oregon climate assessment report. Corvallis OR: Oregon State University, Oregon Climate Change Research Institute. 106 p. Available online http://www.occri.net/media/1055/ocar3_final_all_01-30-2017_compressed.pdf. Accessed 3 Mar 2020.
Davidson K, Gowen RJ, Harrison PJ, Fleming LE, Hoagland P, Moschonas G. 2014. Anthropogenic nutrients and harmful algae in coastal waters. Journal of Environmental Management 146:206–16. doi:10.1016/j.jenvman.2014.07.002.
Dawson JP, Bloomer BJ, Winner DA, Weaver CP. 2014. Understanding the meteorological drivers of US particulate matter concentrations in a changing climate. Bulletin of the American Meteorological Society 95(4):521-32. http://dx.doi.org/10.1175/BAMS-D-12-00181.1
DeFranco E, Moravec W, Xu F, Hall E, Hossain M, Haynes EN, Muglia L, Chen A. 2016. Exposure to airborne particulate matter during pregnancy is associated with preterm birth: a population-based cohort study. Environmental Health-UK 15(1):6. doi:10.1186/s12940-016-0094-3.
Dennekamp M, Straney LD, Erbas B, Abramson MJ, Keywood M, Smith K, Sim MR, Glass DC, Del Monaco A, Haikerwal A, Tonkin A. 2015. Forest fire smoke exposures and out-of-hospital cardiac arrests in Melbourne, Australia: a case-crossover study. Environmental Health Perspectives 123(10):959–64. doi:10.1289/ehp.1408436.
Dennison PE, Brewer SC, Arnold JD, Moritz MA. 2014. Large wildfire trends in the western United States, 1984-2011. Geophysical Research Letters 41(8):2928-33. http://dx.doi.org/10.1002/2014GL059576.
Deutsch CA, Tewksbury JJ, Tigchelaar M, Battisti DS, Merrill SC, Huey RB, Naylor RL. 2018. Increase in crop losses to insect pests in a warming climate. Science 361(6405):916–9. doi:10.1126/science.aat3466.
Di Q, Wang Yan, Zanobetti A, Wang Yun, Koutrakis P, Choirat C, Dominici F, Schwartz JD. 2017. Air pollution and mortality in the Medicare population. New England Journal of Medicine 376(26):2513–22. doi:10.1056/nejmoa1702747.
Dominici F, Peng RD, Bell ML, Pham L, McDermott A, Zeger SL, Samet JM. 2006. Fine particulate air pollution and hospital admission for cardiovascular and respiratory diseases. Journal of the American Medical Association 295(10):1127–34. doi:10.1001/jama.295.10.1127.
Doppelt B. 2016. Transformational resilience: how building human resilience to climate disruption can safeguard society and increase well-being. New York: Greenleaf Publishing. 368 p.
Doyle JT, Redsteer MH, Eggers MJ. 2013. Exploring effects of climate change on Northern Plains American Indian health. Climatic Change 120(3):643–55. doi:10.1007/s10584-013-0799-z.
Dreessen J, Sullivan J, Delgado R. 2016. Observations and impacts of transported Canadian wildfire smoke on ozone and aerosol air quality in the Maryland region on June 9-12, 2015. Journal of the Air and Waste Management Association 66(9):842-62. http://dx.doi.org/10.1080/10962247.2016.1161674.
Du W, FitzGerald G, Clark M, Hou X-Y. 2010. Health impacts of floods. Prehospital Disaster Medicine 25(3):265–72. doi:10.1017/s1049023x00008141.
Ebi KL, Balbus JM, Luber G, Bole A, Crimmins A, Glass G, Saha S, Shimamoto MM, Trtanj J, White-Newsome JL. 2018. Human health [chapter 14]. In: Reidmiller DR, Avery CW, Easterling DR, Kunkel KE, Lewis KLM, Maycock TK, Stewart BC (eds). Impacts, risks, and adaptation in the United States: Fourth National Climate Assessment, vol II. Washington DC: US Global Change Research Program. p 539–71. Available online https://nca2018.globalchange.gov/chapter/health. Accessed 3 Mar 2020.
Epstein PR. 2001. West Nile virus and the climate. Journal of Urban Health 78:367–71. https://doi.org/10.1093/jurban/78.2.367.
Epstein PR. 2005. Perspective: climate change and human health. New England Journal of Medicine 353(14):1433-6. doi:10.1056/nejmp058079.
Epstein PR, Diaz HF, Elias S, Grabherr G, Graham NE, Martens WJ, Mosley-Thompson E, Susskind J. 1998. Biological and physical signs of climate change: focus on mosquito-borne diseases. Bulletin of the American Meteorological Society 79(3):409–17.
Epstein Y, Yanovich R. 2019. Heatstroke. New England Journal of Medicine 380(25):2449–59. doi:10.1056/nejmra1810762.
[EWG] Environmental Working Group. [undated]. News reports on algal blooms, 2010 to present [website]. Available online https://www.ewg.org/interactive-maps/2019_algal_blooms/map/. Accessed 3 Mar 2020.
Fann N, Alman B, Broome RA, Morgan GG, Johnston FH, Pouliot G, Rappold AG. 2018. The health impacts and economic value of wildland fire episodes in the US: 2008-2012. Science of the Total Environment 610-611:802-9.
Fleischer NL, Merialdi M, van Donkelaar A, Vadillo-Ortega F, Martin RV, Betran A, Souza J, O’Neill MS. 2014. Outdoor air pollution, preterm birth, and low birth weight: analysis of the World Health Organization global survey on maternal and perinatal health. Environmental Health Perspectives 122(4):425–30. doi:10.1289/ehp.1306837.
Fouladkhah AC, Thompson B, Camp JS. 2019. Safety of food and water supplies in the landscape of changing climate. Microorganisms 7(10):469. doi:10.3390/microorganisms7100469.
Friedrich M. 2013. Climate change linked with increase in diarrheal disease. Journal of the American Medical Association 309(19):1985. doi:10.1001/jama.2013.5879.
Füssel HM. 2010. World development report 2010: development and climate change, background note—review and quantitative analysis of indices of climate change exposure, adaptive capacity, sensitivity, and impacts [report]. Potsdam Germany: Potsdam Institute for Climate Impact Research. 35 p. Available online https://openknowledge.worldbank.org/bitstream/handle/10986/9193/WDR2010_.... Accessed 7 May 2020.
Gage AM, Olimb SK, Nelson J. 2016. Plowprint: tracking cumulative cropland expansion to target grassland conservation. Great Plains Research 26:107-16.
Gasparrini A, Guo Y, Hashizume M, Lavigne E, Zanobetti A, Schwartz J, Tobias A, Tong S, Rocklöv J, Forsberg B, Leone M, De Sario M, Bell ML, Leon Guo YL, Wu C-F, Kan H, Yi S-M, de Sousa Zanotti Stagliorio Coelho M, Hilario Nascimento Saldiva P, Honda Y, Kim H, Armstrong B. 2015. Mortality risk attributable to high and low ambient temperature: a multi-country observational study. Lancet 386:369-75. doi:10.1016/S0140-6736(14)62114-0.
Gielen MH, van der Zee SC, van Wijnen JH, van Steen CJ, Brunekreef B. 1997. Acute effects of summer air pollution on respiratory health of asthmatic children. American Journal of Respiratory and Critical Care Medicine 155(6):2105-8. doi:10.1164/ajrccm.155.6.9196122.
Gooding MJ, Ellis RH, Shewry PR, Schofield JD. 2003. Effects of restricted water availability and increased temperature on the grain filling, drying, and quality of winter wheat. Journal of Cereal Science 37(3):295–309. doi:10.1006/jcrs.2002.0501.
Gowda P, Steiner JL, Olson C, Boggess M, Farrigan T, Grusak MA. 2018. Agriculture and rural communities [chapter 10]. In: Reidmiller DR, Avery CW, Easterling DR, Kunkel KE, Lewis KLM, Maycock TK, Stewart BC (eds). Impacts, risks, and adaptation in the United States: Fourth National Climate Assessment, Volume II. Washington DC: US Global Change Research Program. p 391–437. Available online https://nca2018.globalchange.gov/downloads/NCA4_Ch10_Agriculture_Full.pdf. Accessed 8 May 2020.
Gubernot DM, Anderson BG, Hunting KL. 2015. Characterizing occupational heat‐related mortality in the United States, 2000–2010: an analysis using the census of fatal occupational injuries database. American Journal of Industrial Medicine 58(2):203–11. doi:10.1002/ajim.22381.
Ha S, Liu D, Zhu Y, Kim S, Sherman S, Mendola P. 2016. Ambient temperature and early delivery of singleton pregnancies. Environmental Health Perspectives 125(3):453–9. doi:10.1289/ehp97.
Haas JD, Brownlie T. 2001. Iron deficiency and reduced work capacity: a critical review of the research to determine a causal relationship. Journal of Nutrition 131(2):676S-90S. doi:10.1093/jn/131.2.676s.
Haikerwal A, Akram M, Monaco A, Smith K, Sim MR, Meyer M, Tonkin AM, Abramson MJ, Dennekamp M. 2015. Impact of fine particulate matter (PM2.5) exposure during wildfires on cardiovascular health outcomes. Journal of the American Heart Association 4(7):e001653. doi:10.1161/jaha.114.001653.
Harrigan RJ, Thomassen HA, Buermann W, Smith TB. 2014. A continental risk assessment of West Nile virus under climate change. Global Change Biology 20:2417–25. https://doi.org/10.1111/gcb.12534.
Hayes K, Blashki G, Wiseman J, Burke S, Reifels L. 2018. Climate change and mental health: risks, impacts and priority actions. International Journal of Mental Health Systems 12(1):28. doi:10.1186/s13033-018-0210-6.
Ho HC, Knudby A, Huang W. 2015. A spatial framework to map heat health risks at multiple scales. International Journal of Environmental Research and Public Health 12:16110–23. doi:10.3390/ijerph121215046.
Holden ZA, Swanson A, Luce CH, Jolly WM, Maneta M, Oyler JW, Warren DA, Parsons R, Affleck D. 2018. Decreasing fire season precipitation increased recent western US forest wildfire activity. Proceedings of the National Academy of Sciences 115(36):E8349-E8357. https://doi.org/10.1073/pnas.1802316115.
Howard M, Ahmed S, Lachapelle P, Schure MB. 2020. Farmer and rancher perceptions of climate change and their relationships with mental health. Journal of Rural Mental Health 44(2):87-95. https://doi.org/10.1037/rmh0000131.
Hsiang SM, Burke M, Miguel E. 2013. Quantifying the influence of climate on human conflict. Science 341(6151):1235367. doi:10.1126/science.1235367.
Hughes MK, Diaz HF. 2008. Climate variability and change in the drylands of western North America. Global and Planetary Change 64(3-4):111-8.
Hutchinson J, Vargo J, Milet M, French N, Billmire M, Johnson J, Hoshiko S. 2018. The San Diego 2007 wildfires and Medi-Cal emergency department presentations, inpatient hospitalizations, and outpatient visits: an observational study of smoke exposure periods and a bidirectional case-crossover analysis. Plos Medicine 15(7):e1002601. doi:10.1371/journal.pmed.1002601.
[IDDEQ] Idaho Department of Environmental Quality. 2013 (Dec 6). Request for EPA concurrence as exceptional events for 2012 wildfire impacts on PM2.5 monitor values at Salmon and Pinehurst Idaho [report]. 275 p. Available online http://www.deq.idaho.gov/media/1187/exceptional-events-request-pinehurst.... Accessed 13 May 2020.
Inostroza L, Palme M, de la Barrera F. 2016. A heat vulnerability index: spatial patterns of exposure, sensitivity, and adaptive capacity for Santiago de Chile. PLOS ONE 11(9):e0162464. doi:10.1371/journal.pone.0162464.
Insurance Information Institute [undated]. Facts + statistics: wildfires [website]. Available online https://www.iii.org/fact-statistic/facts-statistics-wildfires. Accessed 25 Apr 2020.
[IPCC] Intergovernmental Panel on Climate Change. 2019. Summary for policymakers [chapter]. In: Pörtner H-O, Roberts DC, Masson-Delmotte V, Zhai P, Tignor M, Poloczanska E, Mintenbeck K, Nicolai M, Okem A, Petzold J, Rama B, Weyer N (eds.). IPCC special report on the ocean and cryosphere in a changing climate. Available online https://www.ipcc.ch/srocc/chapter/summary-for-policymakers/. Accessed 3 Mar 2020.
Irwin J, Jeffrey K. 2001. Anemia in children. American Family Physician 64(8):1379-87.
Isaksen T, Fenske RA, Hom EK, Ren Y, Lyons H, Yost MG. 2016. Increased mortality associated with extreme-heat exposure in King County, Washington, 1980–2010. International Journal of Biometeorology 60(1):85–98. doi:10.1007/s00484-015-1007-9.
Jaffe D, Chand D, Haffner W, Westerling A, Spracklen D. 2008. Influences of fire on O3 concentrations in the western US. Environmental Science and Technology 42(16):5885-91. http://dx.doi.org/10.1021/es800084k.
Jaffe DA, Widger NL. 2012. Ozone production from wildfires: a critical review. Atmospheric Environment 51:1-10. http://dx.doi.org/10.1016/j.atmosenv.2011.11.063.
Jáuregui-Lobera I. 2014. Iron deficiency and cognitive functions. Neuropsychiatric Disease and Treatment 10:2087–95. doi:10.2147/ndt.s72491.
Jenkins MJ, Runyon JB, Fettig CJ, Page WG, Bentz BJ. 2014. Interactions among the mountain pine beetle, fires, and fuels. Forest Science 60(3):489-501. http://dx.doi.org/10.5849/forsci.13-017
Jhun I, Mata DA, Nordio F, Lee M, Schwartz J, Zanobetti A. 2017. Ambient temperature and sudden infant death syndrome in the United States. Epidemiology 28(5):728. doi:10.1097/ede.0000000000000703.
Johnston FH, Henderson SB, Chen Y, Randerson JT, Marlier M, DeFries RS, Kinney P, Bowman D, Brauer M. 2012. Estimated global mortality attributable to smoke from landscape fires. Environmental Health Perspectives 120(5):695–701. doi:10.1289/ehp.1104422.
Jolly WM, Cochrane MA, Freeborn PH, Holden ZA, Brown TJ, Williamson GJ, Bowman DM. 2015. Climate-induced variations in global wildfire danger from 1979 to 2013. Nature Communications 6:7537.
Knowlton K, Rotkin-Ellman M, King G, Margolis HG, Smith D, Solomon G, Trent R, English P. 2009. The 2006 California heat wave: impacts on hospitalizations and emergency department visits. Environmental Health Perspectives 117(1):61–7. doi:10.1289/ehp.11594.
Kollanus V, Tittanen P, Niemi JV, Lanki T. 2016. Effects of long-range transported air pollution from vegetation fires on daily mortality and hospital admissions in the Helsinki metropolitan area, Finland. Environmental Research 151:351-8. doi:10.1016/j.envres.2016.08.003
Lake IR, Hooper L, Abdelhamid A, Bentham G, Boxall ABA, Draper A, Fairweather-Tait S, Hulme M, Hunter PR, Nichols G, Waldron KW. 2012. Climate change and food security: health impacts in developed countries. Environmental Health Perspectives 120(11):1520–6. doi:10.1289/ehp.1104424.
Lamond J, Joseph RD, Proverbs DG. 2015. An exploration of factors affecting the long-term psychological impact and deterioration of mental health in flooded households. Environmental Research 140:325–34. doi:10.1016/j.envres.2015.04.008.
Laurent J, Williams A, Oulhote Y, Zanobetti A, Allen JG, Spengler JD. 2018. Reduced cognitive function during a heat wave among residents of non-air-conditioned buildings: an observational study of young adults in the summer of 2016. PLOS Medicine 15(7):e1002605. doi:10.1371/journal.pmed.1002605.
Lesk C, Rowhani P, Ramankutty N. 2016. Influence of extreme weather disasters on global crop production. Nature 529(7584):84–8. doi:10.1038/nature16467.
Levy K, Woster AP, Goldstein RS, Carlton EJ. 2016. Untangling the impacts of climate change on waterborne diseases: a systematic review of relationships between diarrheal diseases and temperature, rainfall, flooding, and drought. Environmental Science and Technology 50(10):4905–22. doi:10.1021/acs.est.5b06186.
Levy BS, Roelofs C. 2019. Impacts of climate change on workers’ health and safety [report]. In Oxford Research Encyclopedias: global public health. doi:10.1093/acrefore/9780190632366.013.39.
Liu JC, Pereira G, Uhl SA, Bravo MA, Bell ML. 2015. A systematic review of the physical health impacts from non-occupational exposure to wildfire smoke. Environmental Research 136:120-32. http://dx.doi.org/10.1016/j.envres.2014.10.015.
Liu J, Mickley LJ, Sulprizio MP, Dominici F, Yue X, Ebisu K, Anderson G, Khan RF, Bravo MA, Bell ML. 2016. Particulate air pollution from wildfires in the western US under climate change. Climatic Change 138(3):655–66. doi:10.1007/s10584-016-1762-6.
Liu JC, Wilson A, Mickley LJ, Ebisu K, Sulprizio MP, Wang Y, Peng RD, Yue X, Dominici F, Bell ML. 2017. Who among the elderly is most vulnerable to exposure to and health risks of fine particulate matter from wildfire smoke? American Journal of Epidemiology 186(6):730-5. http://dx.doi.org/10.1093/aje/kwx141.
McKenzie D, Littell JS. 2017. Climate change and the eco‐hydrology of fire: will area burned increase in a warming western USA? Ecological Applications 27:26-36. doi:10.1002/eap.1420.
McWethy DB, Schoennagel T, Higuera PB, Krawchuk M, Harvey BJ, Metcalf EC, Schultz C, Miller C, Metcalf AL, Buma B, Virapongse A, Kulig JC, Stedman RC, Ratajczak Z, Nelson CR, Kolden C. 2019. Rethinking resilience to fire. Nature Sustainability 2:797-804. doi:10.1038/s41893-019-0353-8.
Medek DE, Schwartz J, Myers SS. 2017. Estimated effects of future atmospheric CO2 concentrations on protein intake and the risk of protein deficiency by country and region. Environmental Health Perspectives 125(8). doi:10.1289/ehp41.
Meehi GA, Tebaldi C. 2004. More intense, more frequent, and longer lasting heat waves in the 21st century. Science 305:994-7.
Melillo JM, Richmond TC, Yohe GW (eds). 2014. Climate change impacts in the United States: the Third National Climate Assessment. Washington DC: US Global Change Research Program. 841 p. doi:10.7930/J0Z31WJ2.
Mills D, Schwartz J, Lee M, Sarofim M, Jones R, Lawson M, Duckworth M, Deck L. 2015. Climate change impacts on extreme temperature mortality in select metropolitan areas in the United States. Climatic Change 131:83-95. doi:10.1007/s10584-014-1154-8.
Moore SK, Mantua NJ, Salathé EP. 2011. Past trends and future scenarios for environmental conditions favoring the accumulation of paralytic shellfish toxins in Puget Sound shellfish. Harmful Algae 10(5):521–9. doi:10.1016/j.hal.2011.04.004.
Morabito MA, Crisci A, Messeri A, Capecchi V, Modesti PA, Gensini GF, Orlandini S. 2014. Environmental temperature and thermal indices: what is the most effective predictor of heat-related mortality in different geographical contexts? Scientific World Journal 2014(ID 961750). doi:10.1155/2014/961750.
Mordecai EA, Paaijmans KP, Johnson LR, Balzer C, Ben-Horin T, de Moor E, McNally A, Pawar S, Ryan SJ, Smith TC, Lafferty KD. 2012. Optimal temperature for malaria transmission is dramatically lower than previously predicted. Ecology Letters 16(1):22–30. doi:10.1111/ele.12015.
Mordecai EA, Cohen JM, Evans MV, Gudapati P, Johnson LR, Lippi CA, Miazgowicz K, Murdock CC, Rohr JR, Ryan SJ, Savage V, Shocket MS, Ibarra AS, Thomas MB, Weikel DP. 2017. Detecting the impact of temperature on transmission of Zika, dengue, and chikungunya using mechanistic models. PLOS Neglected Tropical Diseases 11(4):e0005568. doi:10.1371/journal.pntd.0005568.
Mordecai EA, Caldwell JM, Grossman MK, Lippi CA, Johnson LR, Neira M, Rohr JR, Ryan SJ, Savage V, Shocket MS, Sippy R, Ibarra AMS, Thomas MB, Villena O. 2019. Thermal biology of mosquito‐borne disease. Ecology Letters 22(10):1690–708. doi:10.1111/ele.13335.
Moyce S, Mitchell D, Armitage T, Tancredi D, Joseph J, Schenker M. 2017. Heat strain, volume depletion, and kidney function in California agricultural workers. Occupational and Environmental Medicine 74(6):402-9.
[MTDEQ] Montana Department of Environmental Quality. [undated]. Archived wildfire smoke updates [website]. Available online http://svc.mt.gov/deq/todaysair/smokereport/SmokeList.aspx?smokeYear=2012. Accessed 8 May 2020.
[MTDEQ] Montana Department of Environmental Quality. [undated]. Climate change and natural resources: water [website]. Available online http://deq.mt.gov/Energy/climatechange/naturalresources/Water/WaterQuality. Accessed 21 August 2020.
[MTDEQ] Montana Department of Environmental Quality. 2019 (Jan 31). Final 2018 water quality integrated report. Helena MT: Montana Department of Environmental Quality. 73 p. Available online http://deq.mt.gov/Portals/112/Water/WQPB/CWAIC/Reports/IRs/2018/2018_IR_.... Accessed 21 Aug 2020.
[MTDPHHSa] Montana Department of Health and Human Safet. [undated]. Public health and safety: harmful algal blooms [website]. Available online https://dphhs.mt.gov/publichealth/Epidemiology/hab. Accessed 24 Apr 2020.
[MTDPHHSb] Montana Department of Public Health and Human Services. [undated]. Tick-borne illnesses [website]. Available online https://dphhs.mt.gov/publichealth/cdepi/diseases/ticks. Accessed 3 Mar 2020.
[MTDPHHSc] Montana Department of Public Health and Human Services. [undated]. West Nile virus [website]. Available online https://dphhs.mt.gov/publichealth/cdepi/diseases/westnilevirus. Accessed 3 Mar 2020.
[MTDPHHS] Montana Department of Public Health and Human Services. 2013. The burden of asthma in Montana Report, 2013 [internal report]. 33 p. Available online https://dphhs.mt.gov/Portals/85/publichealth/documents/Asthma/AsthmaBurd.... Accessed 20 May 2020.
Myers SS, Zanobetti A, Kloog I, Huybers P, Leakey ADB, Bloom AJ, Carlisle E, Dietterich LH, Fitzgerald G, Hasegawa T, Holbrook NM, Nelson RL, Ottman MJ, Raboy V, Sakai H, Sartor KA, Schwartz J, Seneweera S, Tausz M, Usui Y. 2014. Increasing CO2 threatens human nutrition. Nature 510:139–42.
Navarro KM, Cisneros R, O’Neill SM, Schweizer D, Larkin NK, Balmes JR. 2016. Air-quality impacts and intake fraction of PM2.5 during the 2013 Rim Megafire. Environmental Science and Technology 50 (21):11965-73. http://dx.doi.org/10.1021/acs.est.6b02252.
[NCHS] National Center for Health Statistics. [undated]. National health and nutrition survey [website]. Available online https://www.cdc.gov/nchs/nhanes/index.htm. Accessed 2019 Dec 20.
Nelson GC, Valin H, Sands RD, Havlík P, Ahammad H, Deryng D, Elliott J, Fujimori S, Hasegawa T, Heyhoe E, plus 14 more. 2014. Climate change effects on agriculture: economic responses to biophysical shocks. Proceedings of the National Academy of Sciences 111(9):3274–9. doi:10.1073/pnas.1222465110.
[NIFC] National Interagency Fire Center. [undated]. Fire information and statistics [website]. Available online https://www.nifc.gov/fireInfo/fireInfo_statistics.html. Accessed 22 Aug 2020.
[NOAA-NCEIa] National Oceanic and Atmospheric Administration—National Centers for Environmental Information. Storm data [website]. Available online https://www.ncdc.noaa.gov/IPS/sd/sd.html. Accessed 13 May 2020.
[NOAA-NCEIb] National Oceanic and Atmospheric Administration—National Centers for Environmental Information. National climate report—annual 2011 [website]. Available online https://www.ncdc.noaa.gov/sotc/national/201113. Accessed 13 May 2020.
Nolte CG, Dolwick PD, Fann N, Horowitz LW, Naik V, Pinder RW, Spero TL, Winner DA, Ziska LH. 2018. Air quality [chapter 13]. In: Reidmiller DR, Avery CW, Easterling DR, Kunkel KE, Lewis KLM, Maycock TK, Stewart BC (eds). Impacts, risks, and adaptation in the United States: Fourth National Climate Assessment, Volume II. Washington DC: US Global Change Research Program. p 512-38. Available online https://nca2018.globalchange.gov/downloads/NCA4_Ch13_Air-Quality_Full.pdf. Accessed 14 May 2020.
Norby RJ, Warren JM, Iversen CM, Medlyn BE, McMurtrie RE. 2010. CO2 enhancement of forest productivity constrained by limited nitrogen availability. Proceedings of the National Academy of Sciences USA 107(45):19368-73. http://dx.doi.org/10.1073/pnas.1006463107
[NWS] National Weather Service [undated]. Weather-related fatality and injury statistics [website]. Available online https://www.weather.gov/hazstat/. Accessed 19 Feb 2020.
Obradovich N, Migliorini R, Paulus MP, Rahwan I. 2018. Empirical evidence of mental health risks posed by climate change. Proceedings of the National Academy of Sciences 115(43):201801528. doi:10.1073/pnas.1801528115.
Ogden NH. 2017. Climate change and vector-borne diseases of public health significance. FEMS Microbiology Letters 364(19). doi:10.1093/femsle/fnx186.
Olsson D, Mogren I, Forsberg B. 2013. Air pollution exposure in early pregnancy and adverse pregnancy outcomes: a register-based cohort study. Bmj Open. 3(2):e001955. doi:10.1136/bmjopen-2012-001955.
Orengo-Aguayo R, Stewart RW, de Arellano MA, Suárez-Kindy J, Young J. 2019. Disaster exposure and mental health among Puerto Rican youths after Hurricane Maria. Journal of the American Medical Association Network Open 2(4):e192619. doi:10.1001/jamanetworkopen.2019.2619.
Orru H, Ebi KL, Forsberg B. 2017. The interplay of climate change and air pollution on health. Current Environmental Health Reports 4(4):504-13.
Ostro BD, Roth LA, Green RS, Basu R. 2009. Estimating the mortality effect of the July 2006 California heat wave. Environmental Research 109(5):614–9. doi:10.1016/j.envres.2009.03.010.
Paerl HW, Huisman J. 2009. Climate change: a catalyst for global expansion of harmful cyanobacterial blooms. Environmental Microbiology Reports 1(1):27-37. doi:10.1111/j.1758-2229.2008.00004.x.
Page LA, Hajat S, Kovats SR. 2007. Relationship between daily suicide counts and temperature in England and Wales. British Journal of Psychiatry 191(2):106–12. doi:10.1192/bjp.bp.106.031948.
Palinkas LA, Wong M. 2019. Global climate change and mental health. Current Opinion in Psychology 32:12–6. doi:10.1016/j.copsyc.2019.06.023.
Paterson DL, Wright H, Harris PN. 2018. Health risks of flood disasters. Clinical Infectious Diseases 67(9):1450–4. doi:10.1093/cid/ciy227.
Patz JA, Epstein PR, Burke TA, Balbus JM. 1996. Global climate change and emerging infectious diseases. Journal of the American Medical Association 275(3):217–23. doi:10.1001/jama.1996.03530270057032.
Paull SH, Horton DE, Ashfaq M, Rastogi D, Kramer LD, Diffenbaugh NS, Kilpatrick AM. 2017. Drought and immunity determine the intensity of West Nile virus epidemics and climate change impacts. Proceedings of the Royal Society B—Biological Sciences 284:20162078. https://doi.org/10.1098/rspb.2016.2078
Paulson JA, Ahdoot S, Baum CR, Bole A, Brumberg HL, Campbell CC, Lanphear BP, Lowry JA, Pacheco SE, Spanier AJ, Trasande L. 2015. Global climate change and children’s health. Pediatrics 136(5):992–7. doi:10.1542/peds.2015-3232.
Paz S. 2015. Climate change impacts on West Nile virus transmission in a global context. Philosophical Transactions Royal Society B Biological Sciences 370(1665):20130561. doi:10.1098/rstb.2013.0561.
Peters R, Ee N, Peters J, Booth A, Mudway I, Anstey KJ. 2019. Air pollution and dementia: a systematic review. Journal of Alzheimer’s Disease 70(s1):S145–63. doi:10.3233/jad-180631.
Pi H, Sharratt B. 2017. Evaluation of the RWEQ and SWEEP in simulating soil and PM10 loss from a portable wind tunnel. Soil and Tillage Research 170:94-103.
Pope CA III, Ezzati M, Dockery DW. 2009. Fine-particulate air pollution and life expectancy in the United States. New England Journal of Medicine 360(4):376-86. doi:10.1056/NEJMsa0805646.
Puett RC, Hart JE, Yanosky JD, Paciorek C, Schwartz J, Suh H, Speizer FE, Laden F. 2009. Chronic fine and coarse particulate exposure, mortality, and coronary heart disease in the nurses’ health study. Environmental Health Perspectives 117(11)1697–701. doi:10.1289/ehp.0900572.
Radeloff VC, Helmers DP, Kramer HA, Mockrin MH, Alexandre PM, Bar-Massada A, Butsic V, Hawbaker TJ, Martinuzzi S, Syphard AD, Stewart SI. 2018. Rapid growth of the US wildland-urban interface raises wildfire risk. Proceedings of the National Academy of Sciences USA 115:3314–9. doi:10.1073/pnas.1718850115.
Rani B, Singh U, Chuhan AK, Sharma D, Maheshwari R. 2011. Photochemical smog pollution and its mitigation measures. Journal of Advanced Scientific Research 2(4):28-33.
Rappold AG, Stone SL, Cascio WE, Neas LM, Kilaru VJ, Carraway M, Szykman JJ, Ising A, Cleve WE, Meredith JT, Vaughan-Batten H, Deyneka L, Devlin RB. 2011. Peat bog wildfire smoke exposure in rural North Carolina is associated with cardiopulmonary emergency department visits assessed through syndromic surveillance. Environmental Health Perspectives 119(10):1415–20. doi:10.1289/ehp.1003206.
Reid CE, O’Neill MS, Gronlund CJ, Brines SJ, Brown DG, Diez-Roux AV, Schwartz J. 2009. Mapping community determinants of heat vulnerability. Environmental Health Perspectives 117:1730-6.
Reid CE, Mann J, Alfasso R, English PB, King GC, Lincoln RA, Margolis HG, Rubado DJ, Sabato JE, West NL. 2012. Evaluation of a heat vulnerability index on abnormally hot days: an environmental public health tracking study. Environmental Health Perspectives 120:715-20.
Reid CE, Brauer M, Johnston FH, Jerrett M, Balmes JR, Elliott CT. 2016a. Critical review of health impacts of wildfire smoke exposure. Environmental Health Perspectives 124:1334-43. http://dx.doi.org/10.1289/ehp.1409277.
Reid C, Jerrett M, Tager I, Petersen M, Mann J, Balmes J. 2016b. Differential respiratory health effects from the 2008 northern California wildfires: a spatiotemporal approach. Environmental Research 150:227-35. https://dx.doi.org/10.1016/j.envres.2016.06.012.
Reisen F, Duran SM, Flannigan M, Elliott C, Rideout K. 2015. Wildfire smoke and public health risk. International Journal of Wildland Fire 24(8):1029–44. doi:10.1071/WF15034.
Rosenberg R, Lindsey NP, Fischer M, Gregory CJ, Hinckley AF, Mead PS, Paz-Bailey G, Waterman SH, Drexler NA, Kersh GJ, Hooks H, Partridge SK, Visser SN, Beard CB, Petersen LR. 2018. Vital signs: trends in reported vector-borne disease cases—United States and territories, 2004–2016. Morbidity Mortal Weekly Report 67(17):496–501. doi:10.15585/mmwr.mm6717e1.
Ross ME, Vicedo-Cabrera AM, Kopp RE, Song L, Goldfarb DS, Pulido J, Warner S, Furth SL, Tasian GE. 2018. Assessment of the combination of temperature and relative humidity on kidney stone presentations. Environmental Research 162:97–105. doi:10.1016/j.envres.2017.12.020.
Ryan B, Franklin RC, Burkle FM, Aitken P, Smith E, Watt K, Leggat P. 2015 (Sep 28). Identifying and describing the impact of cyclone-, storm-, and flood-related disasters on treatment management, care, and exacerbations of non-communicable diseases and the implications for public health. PLOS Current Disasters (edition 1). doi:10.1371/currents.dis.62e9286d152de04799644dcca47d9288.
Salas RN, Knappenberger P, Hess J. 2018. 2018 Lancet countdown on health and climate change brief for the United States of America [report]. London UK: Lancet Countdown. 32 p. Available online https://storage.googleapis.com/lancet-countdown/2019/10/2018-lancet-coun.... Accessed 13 May 2020.
Sarofim MC, Saha S, Hawkins MD, Mills DM, Hess J, Horton R, Kinney P, Schwartz J, St. Juliana A. 2016. Temperature-related death and illness [chapter 2]. In: Crimmins A, Balbus J, Gamble JL, Beard CB, Bell JE, Dodgen D, Eisen RJ, Fann N, Hawkins MD, Herring SC, Jantarasami L, Mills DM, Saha S, Sarofim MC, Trtanj J, Ziska L (eds). The impacts of climate change on human health in the United States: a scientific assessment. Washington DC: US Global Change Research Program. p 43–68. Available online https://s3.amazonaws.com/climatehealth2016/low/ClimateHealth2016_02_Temp.... Accessed 22 Apr 2020.
Schwartz J, Dockery DW, Neas LM. 1996. Is daily mortality associated specifically with fine particles? Journal of Air and Waste Management Association 46(10)927-39. doi:10.1080/10473289.1996.10467528.
Shander A, Goodnough LT, Javidroozi M, Auerbach M, Carson J, Ershler WB, Ghiglione M, Glaspy J, Lew I. 2014. Iron deficiency anemia—bridging the knowledge and practice gap. Transfusion Medicine Reviews 28(3):156–66. doi:10.1016/j.tmrv.2014.05.001.
Sharratt B, Young F, Feng G. 2017. Wind erosion and PM10 emissions from no‐tillage cropping systems in the Pacific Northwest. Agronomy Journal 109(4):1303-11.
Smit B, Wandel J. 2006. Adaptation, adaptive capacity, and vulnerability. Global Environmental Change 16(2006)282–92. Available online https://www.parc.ca/mcri/pdfs/papers/iacc023.pdf. Accessed 7 May 2020.
Smith MR, Myers SS. 2018. Impact of anthropogenic CO2 emissions on global human nutrition. Nature Climate Change 8:834–9. doi:10.1038/s41558-018-0253-3.
Sonenshine DE. 2018. Range expansion of tick disease vectors in North America: implications for spread of tick-borne disease. International Journal of Environmental Research and Public Health 15(3):478. doi:10.3390/ijerph15030478.
Sorensen C, Garcia-Trabanino R. 2019. A new era of climate medicine—addressing heat-triggered renal disease. New England Journal of Medicine 381(8):693–6. doi:10.1056/nejmp1907859.
Spector JT, Bonauto DK, Sheppard L, Busch-Isaksen T, Calkins M, Adams D, Lieblich M, Fenske RA. 2016. A case-crossover study of heat exposure and injury risk in outdoor agricultural workers. PLOS ONE 11(10):e0164498. http://dx.doi.org/10.1371/journal.pone.0164498.
Springmann M, Mason-D’Croz D, Robinson S, Garnett T, Godfray CH, Gollin D, Rayner M, Ballon P, Scarborough P. 2016. Global and regional health effects of future food production under climate change: a modeling study. Lancet 387(10031):1937–46. doi:10.1016/s0140-6736(15)01156-3.
Summer A, Lora I, Formaggioni P, Gottardo F. 2018. Impact of heat stress on milk and meat production. Animal Frontiers 9(1):39-46. doi:10.1093/af/vfy026.
Takahashi M. 2012. Heat stress on reproductive function and fertility in mammals. Reproductive Medicine and Biology 11:37–47. https://doi.org/10.1007/s12522-011-0105-6.
Tao Z, Larson SM, Williams A, Caughey M, Wuebbles DJ. 2005. Area, mobile, and point source contributions to ground-level ozone: a summer simulation across the continental USA. Atmospheric Environment 39(10):1869-77.
Tinling MA, West JJ, Cascio WE, Kilaru V, Rappold AG. 2016. Repeating cardiopulmonary health effects in rural North Carolina population during a second large peat wildfire. Environmental Health 15(1):12. doi:10.1186/s12940-016-0093-4.
Trasande L, Malecha P, Attina TM. 2016. Particulate matter exposure and preterm birth: estimates of US attributable burden and economic costs. Environmental Health Perspectives 124(12):1913–8. doi:10.1289/ehp.1510810.
Trombley J, Chalupka S, Anderko L. 2017. Climate change and mental health. American Journal of Nursing 117(4):44–52. doi:10.1097/01.naj.0000515232.51795.fa.
[UCS] Union of Concerned Scientists. 2019. Killer heat in the United States; climate choices and the future of dangerously hot days [report]. Dahl K, Spanger-Siegfried E, Licker R, Caldas A, Abatzoglou J, Mailloux N, Cleetus R, Udvardy S, Declet-Barreto J, Worth P, authors. Available online https://www.ucsusa.org/sites/default/files/attach/2019/07/killer-heat-analysis-full-report.pdf. Accessed 15 Sep 2019.
Uddling J, Broberg MC, Feng Z, Pleijel H. 2018. Crop quality under rising atmospheric CO2. Current Opinion in Plant Biology 45(B):262–7. doi:10.1016/j.pbi.2018.06.001.
US Census Bureau. [undated]. 2013-2017 American community survey 5-year estimates [website]. Available online https://www.census.gov/newsroom/press-kits/2018/acs-5year.html. Accessed 25 Apr 2020.
[USEPA] US Environmental Protection Agency. [undated]. Learn about heat islands [website]. Available online https://www.epa.gov/heat-islands/learn-about-heat-islands. Accessed 10 May 2020.
Vescovi L, Rebetez M, Rong F. 2005. Assessing public health risk due to extremely high temperature events: climate and social parameters. Climate Resilience 30:71-8.
Vogel E, Donat MG, Alexander LV, Meinshausen M, Ray DK, Karoly D, Meinshausen N, Frieler K. 2019. The effects of climate extremes on global agricultural yields. Environmental Research Letters 14(5):054010. doi:10.1088/1748-9326/ab154b.
Vox. 2019. The survivors: a year after the Camp Fire nearly leveled Paradise, California, the money is drying up and a lawsuit rages. Can recovery efforts ever return a community to its old self? [article]. Available online https://www.vox.com/the-highlight/2019/10/16/20908291/camp-fire-wildfire.... Accessed 3 Mar 2020.
Wang Yan, Bobb JF, Papi B, Wang Yun, Kosheleva A, Di Q, Schwartz JD, Dominici F. 2016. Heat stroke admissions during heat waves in 1916 US counties for the period from 1999 to 2010 and their effect modifiers. Environmental Health-UK 15(1):83. doi:10.1186/s12940-016-0167-3.
Wang G, Minnis RB, Belant JL, Wax CL. 2010. Dry weather induces outbreaks of human West Nile virus infections. BMC Infectious Disease 10(38). https://doi.org/10.1186/1471-2334-10-38.
Ward TJ, Smith GC. 2001. Air sampling study of the 2000 Montana wildfire season [report]. Missoula MT: University of Montana. 13 p. Available online https://nanopdf.com/download/air-sampling-study-of-the-2000-montana-wild.... Accessed 8 May 2020.
Watts N, Amann M, Arnell N, and 65 more. 2018 (Dec 8). 2018 report of the Lancet Countdown on health and climate change: shaping the health of nations for centuries to come. Lancet 392(Lancet 386 2015):2479–514. doi:10.1016/s0140-6736(18)32594-7.
Watts N, Amann M, Arnell N, and 66 more. 2019. The 2019 report of The Lancet Countdown on health and climate change: ensuring that the health of a child born today is not defined by a changing climate. Lancet 394(10211):1836-78. doi:10.1016/S0140-6736(19)32596-6.
Westerling A, Hidalgo H, Cayan D, Swetnam T. 2006. Warming and earlier spring increase western US forest wildfire activity. Science 313(5789):940–3. doi:10.1126/science.1128834.
Westerling A. 2016. Increasing western US forest wildfire activity: sensitivity to changes in the timing of spring. Philosophical Transactions of the Royal Society B: Biological Sciences 371(1696):20150178. doi:10.1098/rstb.2015.0178.
Wettstein ZS, Hoshiko S, Fahimi J, Harrison RJ, Cascio WE, Rappold AG. 2018. Cardiovascular and cerebrovascular emergency department visits associated with wildfire smoke exposure in California in 2015. Journal of the American Heart Association 7(8). doi:10.1161/jaha.117.007492.
Whitlock C, Cross W, Maxwell B, Silverman N, Wade AA. 2017. 2017 Montana Climate Assessment. Bozeman and Missoula MT: Montana State University and University of Montana, Montana Institute on Ecosystems. 318 p. Available online http://montanaclimate.org. Accessed 9 May 2020. doi:10.15788/m2ww82.
[WSDOH] Washington State Department of Health. 2018. Washington tracking network: a source for environmental public health data [web tool]. Available online https://fortress.wa.gov/doh/wtn/WTNIBL/. Accessed 3 Mar 2020.
Wuebbles DJ, Fahey DW, Hibbard, DJ, Dokken DJ, Stewart BC, Maycock TK (eds). 2017. Climate Science Special Report: Fourth National Climate Assessment, Volume I. Washington DC: US Global Change Research Program. 470 p. doi: 10.7930/J0J964J6.
[WUMCD] West Umatilla Mosquito Control District. [undated]. Disease surveillance: mosquito pools [webpage]. Accessible online http://www.wumcd.org/surveillance/pools.html#:~:text=What%20is%20a%20mos.... Accessed 31 Oct 2020.
Xu Z, Tong S. 2017. Decompose the association between heatwave and mortality: which type of heatwave is more detrimental? Environmental Research 156:770-4.
Yue X, Mickley LJ, Logan JA, Kaplan JO. 2013. Ensemble projections of wildfire activity and carbonaceous aerosol concentrations over the western United States in the mid-21st century. Atmospheric Environment 77:767-80. doi:10.1016/j.atmosenv.2013.06.003.
Zanobetti A, Schwartz J. 2008. Is there adaptation in the ozone mortality relationship: a multi-city case-crossover analysis. Environmental Health-UK 7(1):22. doi:10.1186/1476-069x-7-22.
Zhang K, Li Y, Schwartz J, O’Neill M. 2014. What weather variables are important in predicting heat-related mortality? A new application of statistical learning methods. Environmental Research 132:350-9.
Zhang Y, Bielory L, Cai T, Mi Z, Georgopoulos P. 2015. Predicting onset and duration of airborne allergenic pollen season in the United States. Atmospheric Environment 103:297–306. doi:10.1016/j.atmosenv.2014.12.019.
Zhao C, Liu B, Piao S, Wang X, Lobell DB, Huang Y, Huang M, Yao Y, Bassu S, Ciais P, plus 19 others. 2017. Temperature increase reduces global yields of major crops in four independent estimates. Proceedings of the National Academy of Sciences 114(35):9326–31. doi:10.1073/pnas.1701762114.
Ziska LH, Blumenthal DM, Franks SJ. 2019. Understanding the nexus of rising CO2, climate change, and evolution in weed biology. Invasive Plant Science and Management 12(02):79–88. doi:10.1017/inp.2019.12.
Ziska LH, Caulfield FA. 2000. Rising CO2 and pollen production of common ragweed (Ambrosia artemisiifolia L.), a known allergy-inducing species: implications for public health. Functional Plant Biology 27(10):893. doi:10.1071/pp00032.
Ziska LH, Makra L, Harry SK, Bruffaerts N, Hendrickx M, Coates F, Saarto A, Thibaudon M, Oliver G, Damialis A, plus 16 others. 2019. Temperature-related changes in airborne allergenic pollen abundance and seasonality across the northern hemisphere: a retrospective data analysis. Lancet Planetary Health 3(3):e124–31. doi:10.1016/s2542-5196(19)30015-4.