02. CLIMATE CHANGE AND HUMAN HEALTH IN MONTANA
As noted in the Introduction, this assessment brings scientific information about the impacts of climate change on human health to the people of Montana in an organized and understandable manner. In this section, we begin with a short description of Montana’s geography. We then describe how climate and weather differ, as well as past trends and future projections for temperature and precipitation in the state. We next review the climate changes that pose the greatest threat to the physical and mental health of Montanans.
Montana’s Unique Geography
Montana’s climate is as diverse as its landscapes, which vary from high plains grasslands to alpine rock and ice. As the nation’s fourth largest state, and given our location in the interior of North America, Montana is exposed to diverse weather systems that arise from air masses in the Arctic, Pacific, and Gulf of Mexico. The strength and location of these air masses shift seasonally, creating differences in climate and weather across the state and throughout the year. Montana’s complex topography modifies weather systems as they travel over our western mountain ranges and onto the Great Plains. Montana tends to be wetter in the west because of the proximity to Pacific moisture sources and the cooling and condensing effects that result as air masses rise to cross the Continental Divide. The state is generally drier in the east where heating is stronger and elevations are lower.
Montana’s mountains are headwaters to three of the continent’s major river systems: the Missouri, Columbia, and Saskatchewan. As such, snow levels in our region affect water availability far beyond the state’s border. Our mountain snowpack comes largely from Pacific storms. This winter precipitation is the primary water supply serving our state’s waterways, ecosystems, municipalities, farms and ranches, and recreational and tourism industries.
Climate Differs From Weather
Climate change is a description of a region’s average weather conditions as they vary over at least decades. Weather, in contrast, refers to the short-term changes, occurring over minutes to months in the atmosphere, as measured by temperature, humidity, precipitation, atmospheric pressure, and other variables (NASA undated). While Montana’s climate has become warmer in recent decades, weather patterns have shown considerable variability on a day-to-day and month-to-month basis.
Climate change is a description of a region’s average weather conditions as they vary over at least decades. Weather, in contrast, refers to the short-term changes, occurring over minutes to months in the atmosphere, as measured by temperature, humidity, precipitation, atmospheric pressure, and other variables (NASA undated). … The important point is not to confuse weather and year-to-year climate variability with long-term climate trends.
In addition to relatively rapid changes in weather, Montana has also experienced year-to-year variability in climate that relates to global-scale fluctuations in ocean circulation and their influence on the atmosphere. The El Niño-Southern Oscillation (ENSO) is an example of a climate pattern in our region that varies from year to year depending on ocean-atmosphere patterns in the tropical Pacific Ocean and their influence on storm tracks and pressure systems at higher latitudes. Montana experiences different phases of ENSO, each leading to short-term climate conditions:
- El Niño phase.—During an El Niño phase, the tropical Pacific Ocean is warmer than normal and Montana, especially the northwestern region, tends to experience warmer winters.
- La Niña phase.—During the opposite La Niña phase, the tropical ocean is cooler than normal and Montana tends to experience cool, often wet winters.
- ENSO neutral phase.—When the tropical Pacific Ocean experiences near-average temperatures, circulation conditions in Montana are less predictable.
The important point is not to confuse weather and year-to-year climate variability with long-term climate trends. The former two describe short-term, continually shifting conditions observed over days and years; the latter refers to climate conditions as summarized over decades, or longer. When we discuss climate change, we usually refer to a baseline or normal period for comparison. In the 2017 Montana Climate Assessment (Whitlock et al. 2017) and in this report, that normal period is a 30-year time span from 1971-2000.
The Science of Projecting Montana’s Future Climate: an Overview
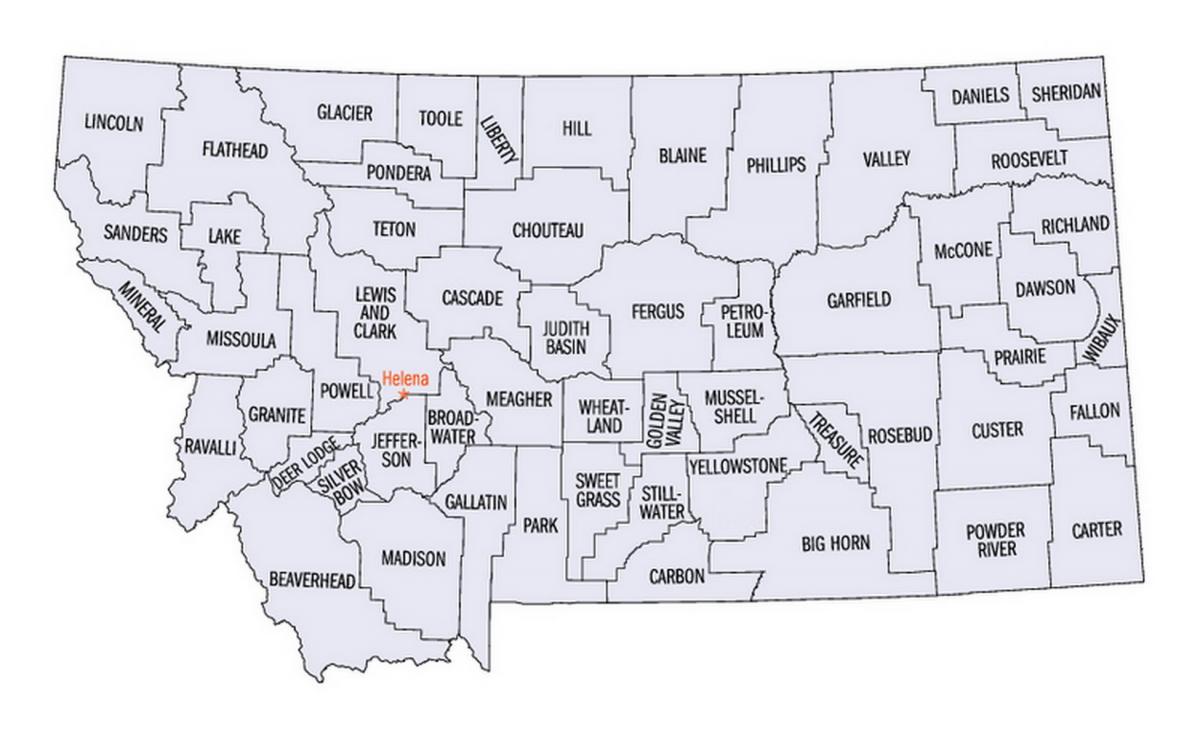
Montana is made up of 56 counties, with climate issues ranging widely—including drought, floods, wildfires, extreme heat, and unexpected weather events—depending on location (Figure 2-1). Each county, likewise, has its own unique history, economy, and level of community connection and, thus, access to healthcare is highly variable.
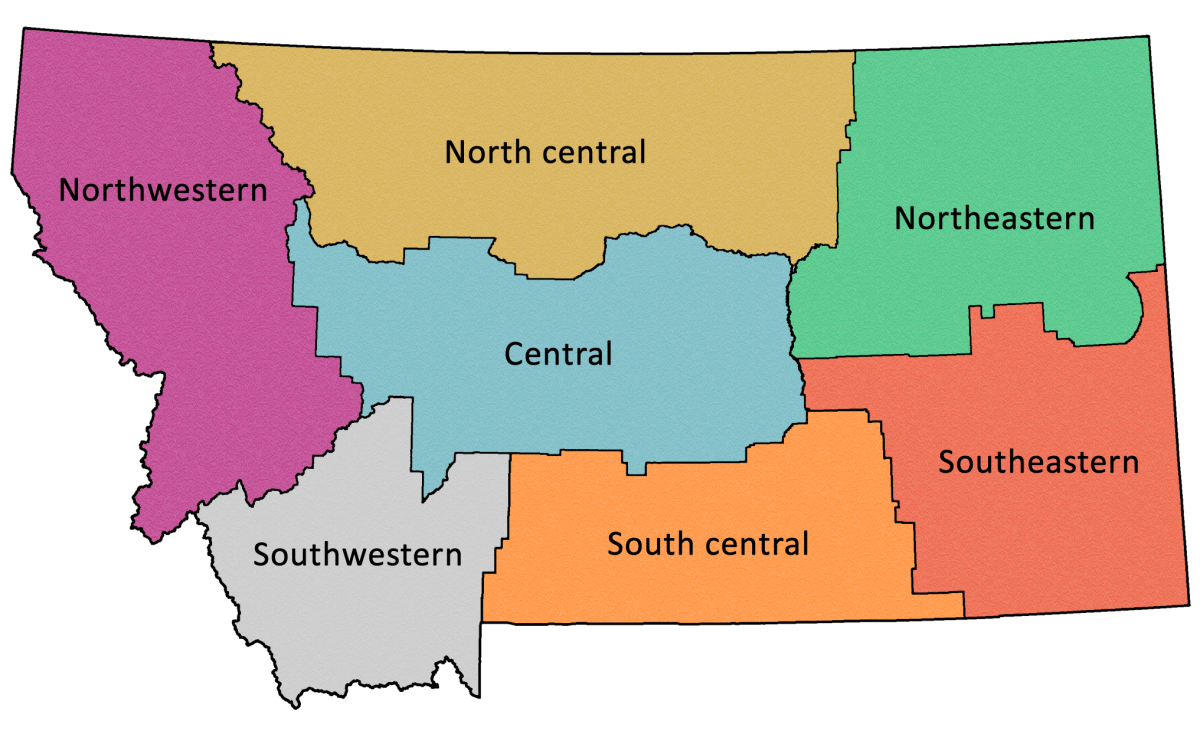
To more readily understand climate change across our state, the 2017 Montana Climate Assessment (Whitlock et al. 2017) aggregates the 56 counties into seven climate divisions, then describes recent climate trends and future projections for those seven divisions. These climate divisions are the Montana subset of the 344 divisions identified by the National Oceanic and Atmospheric Administration (NOAA) to report climate for the US (NOAAa undated). NOAA established the divisions based on climatic, political, agricultural, and watershed boundaries. For Montana, the MCA identifies the seven NOAA divisions as the northwestern, southwestern, north central, central, south central, northeastern, and southeastern climate divisions (Figure 2-2).
MCA analysis of historical climate trends started with the mid-20th century and drew on direct measurements of temperature and precipitation from weather stations across the state. Using statistical methods, these observations were used to derive a single temperature or precipitation value to represent each of the seven climate divisions.
MCA future projections were based on a set of 20 climate models, selected from a larger suite of general circulation models (GCMs) developed by scientists to simulate global climate. GCMs are complex mathematical depictions of the global circulation of the atmosphere and oceans (including the Earth’s frozen waters). These models provide ten-day weather forecasts, as well as projections of future climate. The 20 GCMs included in the MCA were independently developed at research laboratories around the world—as part of the fifth phase of the Coupled Model Intercomparison Project (WCRP undated)—and chosen for their ability to accurately provide daily outputs of climate variables important in Montana. The Montana Climate Office statistically downscaled the coarse-scale GCM output to a finer scale that incorporated the influence of topography on regional climate (Abatzoglou and Brown 2012). The result was projections of future climate for each Montana climate division.
We all wonder about the current trajectory of warming and how it will develop in the future—will it be rapid or gradual? In climate assessments, it is common to see graphs with multiple curves showing different trends in projected climate change through the end of the century. Each curve results from different assumptions regarding future greenhouse gas emissions; the assumptions are based on a range of possible decisions that humankind makes globally from today forward. Those decisions, called scenarios by modelers, include such factors as changing energy sources (fossil fuel or renewable), technological advancements, economic trajectories, and population growth.
The current set of scenarios behind each curve are known as Representative Concentration Pathways (RCPs), and their plausibility is continually re-evaluated as new information comes to light. Again, RCPs describe decisions society might make from today forward. Each scenario-driven pathway results in a particular level of greenhouse gas (CO2, CH4, and others) emission in the coming decades and, as a result, a different amount of temperature increase, precipitation change, and more. While multiple RCPs have been investigated, MCA (Whitlock et al. 2017) focuses on two scenarios for Montana’s future climate, RCP4.5 and RCP8.5[2], as described below:
- RCP4.5, often termed the stabilization scenario of expected carbon use, describes a future trajectory that involves some level of greenhouse gas mitigation (i.e., slowing use because of decisions society makes). The curve shows a near-term rise in the rate of greenhouse gas emissions, with maximum levels reached at about 2040, and a decline in the rate of emissions in the last half of the century (Clarke et al. 2007).
- RCP8.5, which currently represents the upper bound of expected carbon use, describes a future trajectory where greenhouse gas emissions rise at a high rate through the century. The scenario presents a future where humankind does not curb fossil fuel use and the release of greenhouse gases increases without mitigation. RCP8.5 is more extreme than RCP4.5 in its projections of climate change after the mid century, including higher temperatures.
A key goal of this assessment is to identify those aspects of changing temperature and precipitation most likely to have consequences on the physical well-being and mental health of Montanans. In the following subsections, we provide a short review of projections for those two climate variables, which serves as the basis for understanding the impacts of climate change on human health in our state.
A key goal of this assessment is to identify those aspects of changing temperature and precipitation most likely to have consequences on the physical well-being and mental health of Montanans.
Temperature
Increasing temperatures, the most direct consequence of rising greenhouse gases, are a major health concern for Montana, the nation, and the globe. Air temperature has increased in recent decades and that warming will continue in the future. MCA shows that the rate of change per decade in average annual temperature for the period from 1950-2015 was about 0.4oF (0.2oC) statewide, which equates to 2-3oF (1.1-1.7oC) warming in the last 65 yr (Whitlock et al. 2017). More recently, the years 2015 and 2016 were the first and third warmest since 1950, with average annual temperatures 3.2 and 2.9oF (1.8 and 1.6oC) above the base period of 1971-2000 (NOAA b). Likewise, 2017 had average annual temperatures 1.5oF (0.8oC) above this base period, although average annual temperatures for 2018 and 2019 were average or slightly below average (NOAAb undated).
A 70-yr warming trend since 1950 is evident across the state, with greatest warming in the south central climate division (Figure 2-2). Since 1895, Montana’s rate of warming (0.20oF/decade [0.1oC/decade]) has been greater than that of the US (0.15oF/decade [0.08oC/decade]), and this condition reflects the state’s location far from the moderating effects of an ocean. Average maximum and minimum temperatures have also risen across the state since 1950 by 0.3-0.6oF/decade (0.2-0.3oC/decade), amounting to an increase of approximately 3.3oF (1.8oC) for the hottest and coldest conditions (Whitlock et al. 2017).
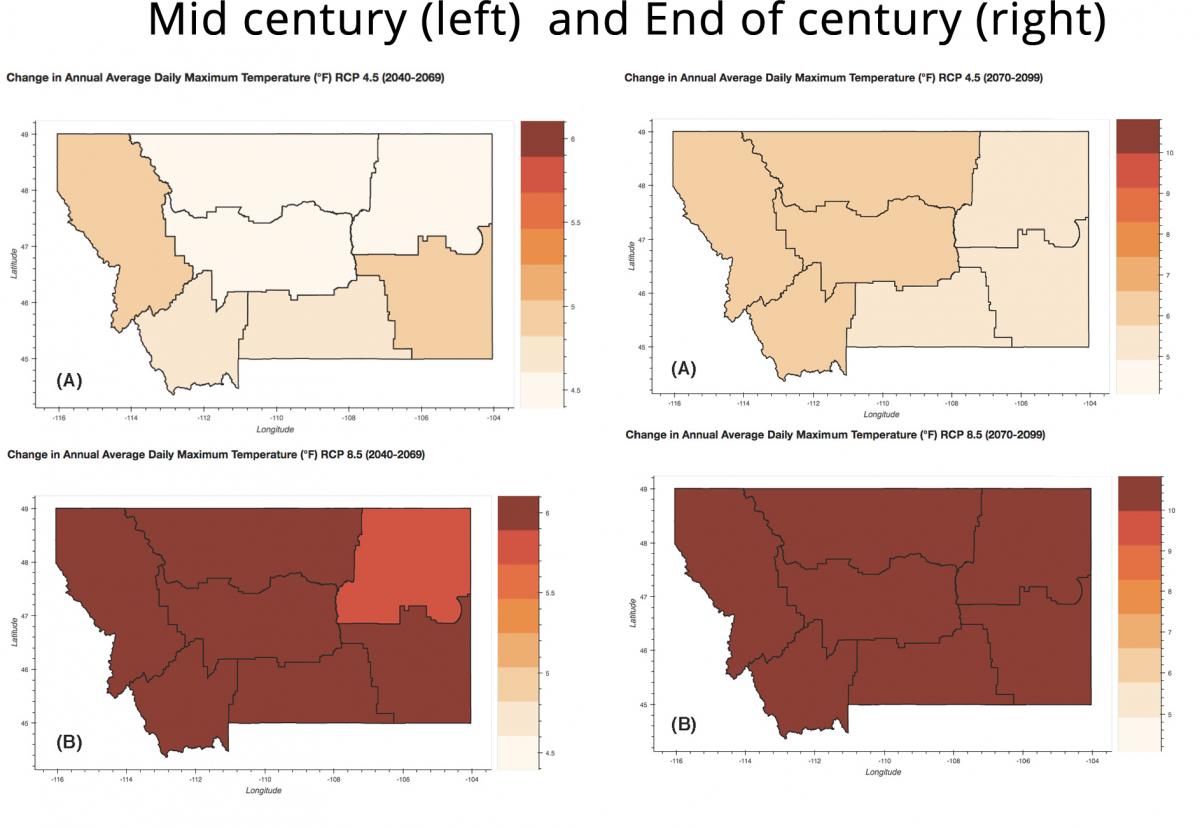
MCA temperature projections for 2040-2069 (mid century) and 2070-2099 (end of century) indicate that current warming trends will continue (Whitlock et al. 2017) (Figure 2-3). By mid century, annual average temperatures are 4.5oF (2.5oC) higher under the RCP4.5 scenario and 6oF (3.3oC) higher under RCP8.5 than the base period (1971-2000). All models agree on the direction of this trend. End-of-century average annual temperatures for the state are more dramatic: increases of 5.6oF (3.1oC) in RCP4.5 and 9.8oF (5.4oC) in RCP8.5, again with full model agreement. Temperature projections show small differences across climate divisions, but overall warming is evident across the state. Projections of average monthly temperatures show temperature increases in all seasons and for all divisions, with summer and winter experiencing the greatest warming. August, in particular, has the greatest monthly change for all divisions.
Daily minimum and maximum temperatures also show a similar magnitude of increase in the coming decades. The number of frost-free days (days where the temperature does not drop below 32oF [0oC]) is conservatively projected to increase by 24-30 days by mid century (RCP4.5 stabilization scenario), particularly in the western division. Extreme-heat days (where the daily temperature exceeds 90oF [32oC]) also increase in the model projections. In the stabilization scenario (RCP4.5), the western and north central climate divisions experience an additional five extreme-heat days, and the northeastern, southeastern, and south central divisions have an increase of 25 extreme-heat days by mid century as compared to the base period (1971-2000). The upper-bound scenario (RCP8.5) elevates the number of days above 90oF (32oC) days by mid century: 11 additional extreme-heat days in the northwest and north central divisions and 33 additional extreme-heat days in the northeastern, southeastern, and south central divisions. These numbers increase further by the end of the century, where the stabilization scenario (RCP4.5) indicates 9-29 additional days.
The upper-bound emission scenario (RCP8.5) shows approximately 34 additional days exceeding 90oF (32oC) in the northwestern, southwestern, and north central divisions, and 54 additional extreme-heat days in the south central, northeastern, and southeastern divisions. The significant increase in the number of extremely warm days in summer and the loss of cold days in winter by the end of the century are important projections in the MCA (Whitlock et al. 2017).
The upper-bound emission scenario (RCP8.5) shows approximately 34 additional days exceeding 90oF (32oC) in the northwestern, southwestern, and north central divisions and 54 additional extreme-heat days in the south central, northeastern, and southeastern divisions. The significant increase in the number of extremely warm days in summer and the loss of cold days in winter by the end of the century are important projections in the MCA (Whitlock et al. 2017).
Precipitation
Montana is a semi-arid region. Thus, the availability and quality of water are critical for the health of the state’s communities and ecosystems. The amount of precipitation varies widely across the state, with elevation, topography, and distance from the Pacific Ocean determining the timing and form of precipitation received. Generally, the western part of the state receives the highest levels of precipitation (average of 22-30 inches [56-76 cm]), and most of it falls in the form of winter and early-spring snow from Pacific storms. The eastern part of the state receives only half the level of precipitation (average of 12-14 inches [30-36 cm]), with moisture sources coming from a combination of Pacific storms in winter and convective storms in late spring and summer. These convective storms are associated with hail, lightning, and sometimes tornados in eastern and central Montana.
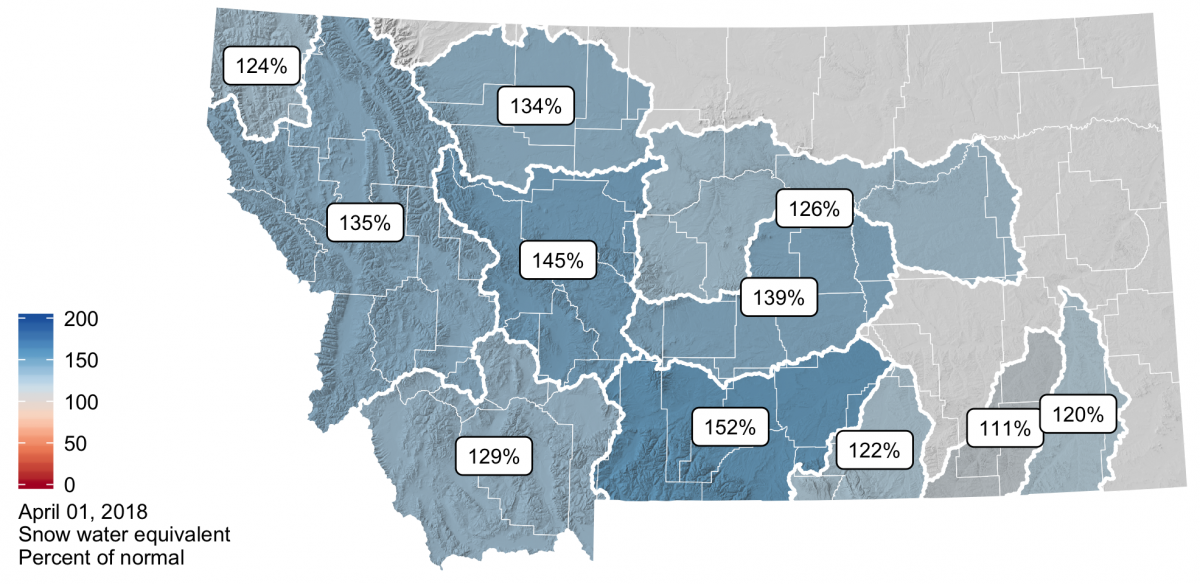
Annual precipitation levels for the state have not changed significantly since 1950, although there is considerable variability among regions in the amount received each year. In general, since 1950 northwestern Montana has become slightly drier in winter, while eastern Montana has become slightly wetter in spring. The year-to-year variation reflects the influence of topography on individual storm tracks, as well as large-scale climate patterns that vary year to year (e.g., ENSO), and creates particular weather conditions. In the winter of 2017-2018, for example, Pacific storms were directed to our region (a La Niña condition), resulting in record-high snow accumulation in Montana. Places in western and central Montana received from 111-152% of normal snowpack, as measured by the April 1 snow water equivalent (Figure 2-4). These high levels of snowpack are likely to be rare in the future, as warmer temperatures force earlier melting and runoff.
Precipitation is a complex phenomenon to simulate in climate models because a number of interactive components in the atmosphere, land, and ocean govern where, when, and how much precipitation falls. These components must be incorporated correctly for general circulation models to accurately portray current conditions and provide credible projections for the future. As a result, GCM projections show less agreement about future precipitation levels than they do for future temperature; this is true at a global scale and also for Montana. MCA suggests that by mid century, precipitation will increase slightly across the state, with 1.3 inch/yr (3.3 cm/yr) more in the northwestern and north central regions and 0.9 inch/yr (2.3 cm/yr) more in the southwestern, central, and eastern climate divisions, as compared to the base period (1971-2000) (Whitlock et al. 2017). The upper-bound scenario (RCP8.5) for mid-century projections suggests an increase of 2.0 inch/yr (5.1 cm/yr) in the western half of the state and 1.8 inch/yr (4.6 cm/yr) in the eastern half. For this scenario, model agreement ranges from 65% for the mid-century summer projections to 95% for the spring projections.
It is important to caution that projected increases in precipitation will likely be more than offset by the coincident rise in temperature. Warming will increase rates of evaporation from soils and water bodies, and transpiration (water loss) from plants (Collins et al. 2013). While we may receive more precipitation, especially in the form of rain, effective moisture (that which remains on the surface and in the ground) will be reduced by the consequences of heat.
MCA projections indicate that winter, spring, and fall will get wetter and summer will get drier in the coming decades, with the likelihood of effective moisture (that which remains on the surface and in the ground) decreasing in all seasons because of rising temperatures.
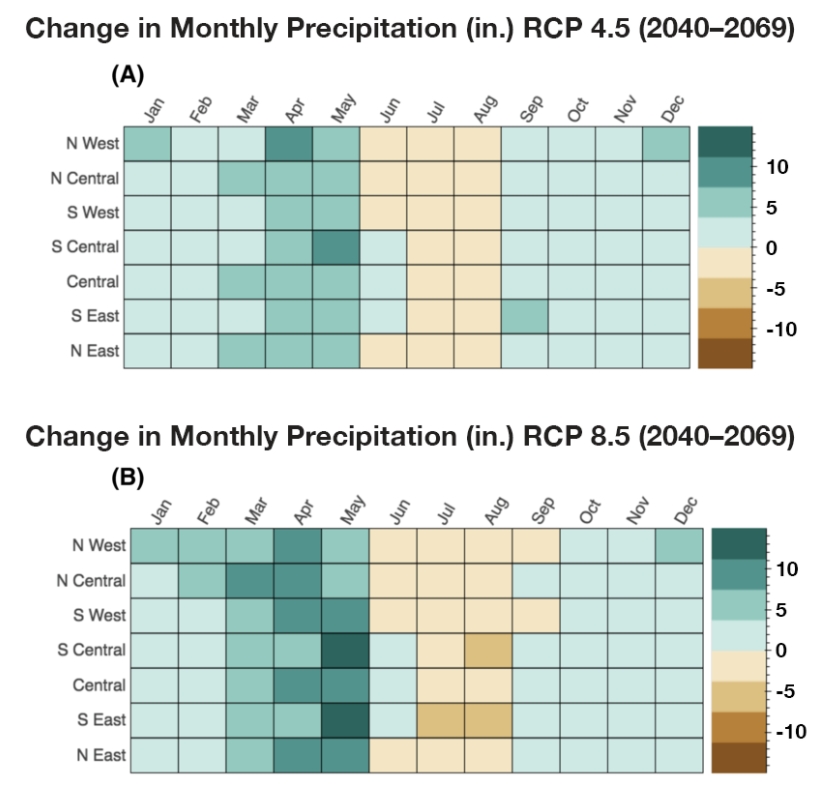
Seasonal differences in the projected changes in precipitation are striking, as analyzed in the MCA (Figure 2-5). In all regions and under both scenarios for the mid century and end of century, precipitation increases markedly in spring (March-May), and less markedly in winter (December-February) and fall (September-October). In contrast, summers (June-August, and in some regions, September) receive less precipitation in the future. The combination of slightly wetter conditions in winter, spring, and fall, coupled with drier summers, both as compared with the base period (1971-2000), is especially striking in the upper-bound emission scenario (RCP8.5) (Figure 2-5). In the end-of-the-century projection, for example, increases in winter and spring precipitation of 0.4 inch/month (1 cm/month) and decreases in summer precipitation of -0.2 inch/month (-0.5 cm/month) are indicated, with 75% model agreement. MCA projections thus indicate that winter, spring, and fall will get wetter and summer will get drier in the coming decades, with the likelihood of effective moisture (that which remains on the surface and in the ground) decreasing in all seasons because of rising temperatures (Whitlock et al. 2017).
Climate Concerns for Human Health
Given this background of current climate trends and future climate projections for Montana, we turn to an overview of how those changes may affect the health and well-being of Montanans. Three elements of projected climate change are of particular concern in our state and deserve close attention from the health community. In subsequent sections of this report, we address the health consequences directly, but first the nature of the climate threats themselves deserves a brief explanation.
Extreme heat
Extreme heat is the most pervasive issue of health concern, with statewide increases in annual temperature of potentially 4-6oF (2.2-3.3oC) by mid century and possibly as great as 9.8oF (5.4oC) by the end of the century, based on RCP8.5 (upper-bound) emission scenario[3]. This rise in temperature continues a warming trend that the state has already experienced during most of the last 120 yr, and especially since 1950. The coldest temperatures during winter will become warmer in the future, which may have positive consequences for some communities and livelihoods. However, the number of extremely warm days in summer will also increase, by over a month in most places and with rural areas of eastern Montana projected to experience the greatest heat stress (Whitlock et al. 2017). Across the US and world, populations living in areas that have experienced extreme heat have suffered from a variety of heat-related health illnesses, and even death.
Given the state’s northerly location, Montanans have not lived through the summer heat experienced in other regions, but this situation will likely change in the future. Some areas of the world have already experienced the heat-index levels that the MCA projects for Montana. People living in those areas have suffered from heat stress and worse. In France, for example, heatwaves are blamed for the deaths of 1500 people in the summer of 2019 (Guardian 2019). Montanans, likewise, are at risk as we expect as many as 2.5 weeks of 105oF (41oC) in the northeastern and southeastern climate divisions by the end of the century (Figure 2-2). These two areas include a large sector of the population that works outdoors in agriculture. Most of the rest of the state is projected to experience up to 10 days reaching 105oF (41oC) by the end of the century.
Smoke and air quality
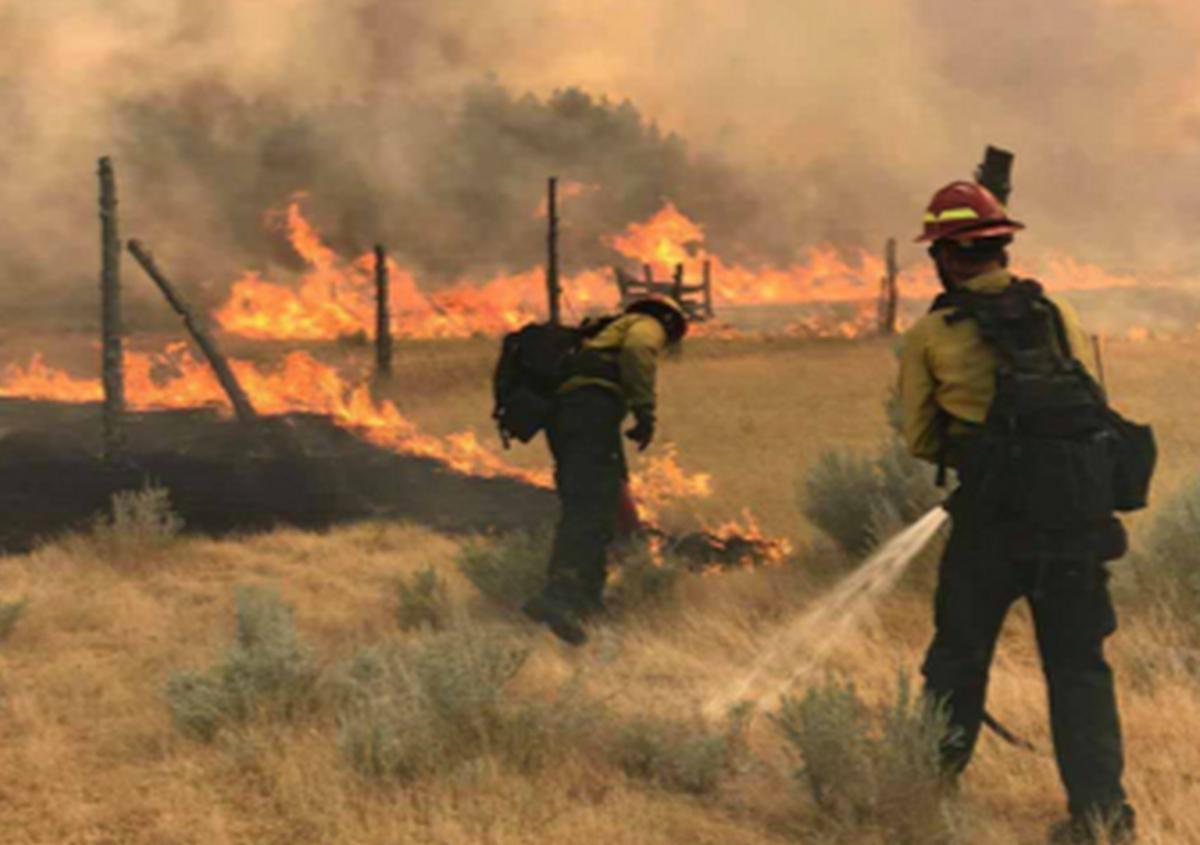
Smoke is likely to become a persistent seasonal feature of our climate, as wildfires become ever larger and more severe across the western US. Smoke fills our valleys from local wildfires, as well as those burning in other western states and Canada. Particulate matter from these fires traps heats, reduces visibility, and creates dangerous air quality conditions. Since the 1970s, the US fire season has lengthened from 5 to over 7 months/yr (see Section 3), and parts of the country now experience wildfires year-round. The link between rising temperature and fire activity is clear: warming summers dry vegetation, and increasing fuels set the stage for fires to ignite and spread. Learning to live with fire has become a priority for Montanans, as increased fire management will not return us to fire frequencies and sizes of the past. Likewise, making our communities better adapted and more resilient to fire and smoke is now a priority in planning efforts (Schoennagel et al. 2017; McWethy et al. 2019).
Climate "surprises"
Climate “surprises” are extreme or unexpected events that can cause great damage to human health and property. The list of events includes abrupt and marked changes in average temperature and altered patterns of storms, floods, droughts, and wildfire. These events take place so rapidly and unexpectedly that human and natural systems often have difficulty adapting.
Rising spring temperatures, for example, have led to a shift from snow to rain in early spring. In addition, snowpack melts more rapidly in spring, resulting in ice jams and streams overflowing their banks, with sometimes disastrous consequences. Severe spring floods have occurred in snow-fed streams in Montana throughout history (NOAAc undated), but recent years have seen unusually large floods on the Clark Fork, Little Big Horn, Missouri, Musselshell, Poplar, Powder, and Yellowstone rivers. These events have led to extensive property and infrastructure damage, as well as loss of human lives. Although it is difficult to predict spring flood events with certainty, they are likely to increase in frequency and severity in the future. Climate projections suggest that the seasonal shift from snow to rain will occur earlier, as will the date of peak spring runoff. Peak runoff on most headwater streams in Montana now occurs 10-20 days earlier than in 1948, and by the end of the century the date of peak runoff is projected to occur 5-35 days earlier than during the period from 1951-1980 (Whitlock et al. 2017).
Another consequence of earlier snowmelt is less water available in late summer, increasing the risk of drought. Some droughts start abruptly; some can last a long time. In the first category are flash droughts, a recently coined phrase that describes a rapid shift from wet to dry conditions following just a few weeks of hot, dry weather (see sidebar). As an example of the latter category, Montana suffered a 307-week drought starting May 2000 (NIDIS undated).
Regardless of length of drought, the impacts to human health range from respiratory issues due to poor air quality from fires or dust storms; to gastrointestinal strife due to declining drinking water quality and/or sanitation services; to increased disease carried by vectors such as mosquitos that breed in stagnant waters (CDC undated). Drought also negatively impacts communities that rely in part on wild foods for sustenance (Smith et al. 2019; Martin et al. 2020).
The 2017 Northern Great Plains Drought
The 2017 Northern Plains drought sparked wildfires, destroyed livestock, and reduced agricultural production. It was the worst drought to impact North Dakota, South Dakota, eastern Montana, and the Canadian prairies in decades.
Neither the drought’s rapid onset—sometimes called a flash drought—nor its severity was forecast. In May 2017, the northern Great Plains region was mostly drought free, and at least average summer precipitation was forecast. By July 2017, the region was experiencing severe to extreme drought, resulting in fires that burned 4.8 million acres (1.9 million hectares) across both countries. US agricultural losses alone exceeded $2.6 billion dollars.
The unique circumstances of this drought provided an opportunity to evaluate the evolution of this type of climate event, as well as improve the effectiveness of drought-related coordination, communication, and management in preparation for future droughts. The National Integrated Drought Information System and partners published two reports that examine the evolution and impacts of the 2017 drought, as well as lessons learned, data needs, and information gaps (Jencso et al. 2019).
Droughts of this type will likely be more frequent in the future, with rising temperatures, reduced snowpack and earlier snowmelt leading to warm dry summer conditions. The seasonal shift from warm and wet to warm and dry could be very rapid, as it was in 2017.
Reduced streamflow in late summer has led to high temperatures in some waterways, stressing the region’s water supplies and ecosystems. Reduced late-season water availability threatens irrigation and community water sources, plus sets the stage for a host of health issues, including vector-borne diseases and mental health concerns (see Section 3). In 2016, Montana Fish, Wildlife, and Parks closed a 184-mile (296-km) stretch of the Yellowstone River because increased water temperatures led to a massive fish kill. The die-off was attributed to a proliferative kidney disease caused by the warmer temperatures (MTFWP 2016).
Other climate surprises are likely but tougher to predict. Tornado and severe thunderstorm events currently cause significant property damage and loss of life every year. Of the US weather disasters that have inflicted more than $1 billion in damage costs in the last 25 yr, over one-third were due to severe storms (NOAAd undated). In Montana, a 2010 tornado in Billings, which caused city officials to declare a state of emergency, resulted in millions of dollars of property damage, including ripping the roof off the 12,000-seat Metra Park Arena (CBS News 2010; NOAA 2010). In May 2016, severe thunderstorms, tornados, and high winds in the Great Plains and Rockies, including Montana, cost over $1.1 billion (NOAAd undated).
The link between severe storms (e.g., tornados, hailstorms, severe thunderstorms) and climate change is not well understood or easily predicted, in part because their documented record is relatively short, going back only to the 1950s. Nonetheless, there is a clear physics-based linkage: as temperatures increase, convection and atmospheric circulation patterns become more extreme and less stable. Weather and extreme events are becoming more frequent and extreme, and their variability is increasing. Past events have been responsible for lives lost and serious and costly property damage, especially for those living in substandard housing. The uncertainty of such events also creates enormous mental stress. Evidence exists that the number of days with tornados is increasing, and it is likely that a warmer world with more atmospheric instability will shift both the timing and extent of severe storm conditions (Kossin et al. 2017). The mechanisms that create these storms, however, are complex and difficult to model (Diffenbaugh et al. 2013; Seeley and Romps 2015).
Summary
In summary, extreme heat, early snowmelt, large wildfires, spring flooding, late-season drought, and climate surprises challenge all aspects of our economy, infrastructure, and well-being. The health effects of these climate extremes include direct injury and loss of life, as well as indirect consequences related to disease, illness, and stress. Human health issues derived from or exacerbated by climate change are now taken seriously by health professionals around the world, and likewise require serious attention in Montana. In the sections that follow, we discuss the physical and mental health issues associated with climate change in Montana, and offer possible actions needed to improve health outcomes.
Montanans and Climate Concerns
A 2019 statewide survey of Montana public health and environmental health professionals asked about climate change concerns (Byron 2019). Of the 222 responses, 89% accepted that global warming is occurring and 69% accepted human causation. They expressed stronger perceptions of climate change risk than the public in recent surveys and US health professionals in most previous surveys. Risk perception evaluates a person's personal concern about risks—whether or not an issue will affect their community or themselves. Risks seen as distant (affecting Africa, for example) do not translate into taking action, whereas risks that are close and personal result in more concern and cause for response.
Most of the health professionals surveyed felt that their own health was already being affected by climate change. They also felt that the mental health effects from climate change would be a concern in the future for their community. Seventy-two percent of the professionals (160 out of 222) felt that health departments should prepare to deal with the public and environmental health effects of climate change, although only 29% of the departments were currently doing so. Nearly all wanted multiple entities to work together to address climate change, including governments (federal, state, local, tribal), elected officials, non-governmental organizations, businesses, individuals, and healthcare providers.
Analysis done in conjunction with the 2019 Yale Climate Opinion Maps for Montana estimated that 60% of Montanans accept that global warming is happening, 45% believe it is mostly human caused, and 30% feel that global warming will hurt them personally in the future (Marlon et al. 2019). In a study to assess Montanans’ opinions on energy and conservation, Metz and Weigel (2016) found that 51% of respondents felt that climate change needs to be addressed now, including taking actions to mitigate greenhouse gases and adapt to changing conditions.
[1] With grateful acknowledgment to the contributions of Kelsey Jencso and Nick Silverman for their work on the climate chapter of the 2017 Montana Climate Assessment (Whitlock et al. 2017).
[2] The RCP number (i.e., 4.5 or 8.5) refers to the resulting watts/m2 of greenhouse-gas-derived heating by the year 2100 if this scenario plays out.
[3] The frequency and severity of these extreme heat events in the future depends on the level of greenhouse gases (CO2, CH4, and others) in the atmosphere, and our ability and willingness to reduce those levels.
Literature Cited
Abatzoglou JT, Brown TJ. 2012. A comparison of statistical downscaling methods suited for wildfire applications, International Journal of Climatology 32:772-80.
Byron L. 2019. Significant concern about climate among Montana public health and environmental health professionals [masters' thesis]. Baltimore MD: Johns Hopkins University. 48 p. Available online https://jscholarship.library.jhu.edu/handle/1774.2/62338. Accessed 31 Mar 2020.
CBS News. 2010 (Jun 1). Montana tornado rips roof off sports arena [news report]. Available online https://www.cbsnews.com/news/montana-tornado-rips-roof-off-sports-arena/. Accessed 1 Mar 2020.
[CDC] Centers for Disease Control and Prevention. [undated]. Drought and health [website]. Available online https://www.cdc.gov/nceh/drought/default.htm. Accessed 1 Mar 2020.
Clarke L, Edmonds J, Jacoby H, Pitcher H, Reilly J, Richels R. 2007 (Jul). Scenarios of greenhouse gas emissions and atmospheric concentrations. Sub-report 2.1a of synthesis and assessment product 2.1 by the US Global Change Science Program and the Subcommittee on Global Change Research. Washington DC: Department of Energy, Office of Biological & Environmental Research. 164 p. Available online https://globalchange.mit.edu/sites/default/files/CCSP_SAP2-1a-FullReport.... Accessed 22 May 2020.
Collins M, Knutti R, Arblaster J, Dufresne J-L, Fichefet T, Friedlingstein P, Gao X, Gutowski WJ, Johns T, Krinner G, Shongwe M, Tebaldi C, Weaver AJ, Wehner M. 2013. Long-term climate change: projections, commitments and irreversibility [chapter]. In: Stocker TF, Qin D, Plattner G-K, Tignor M, Allen SK, Boschung J, Nauels A, Xia Y, Bex V, Midgley PM (eds). Climate change 2013: the physical science basis; contribution of Working Group I to the Fifth Assessment Report of the Intergovernmental Panel on Climate Change. Cambridge UK: Cambridge University Press. p. 1136.
Diffenbaugh NS, Scherer M, Trapp RJ. 2013. Global warming and severe thunderstorms. Proceedings of the National Academy of Sciences 110:16361-6. doi:10.1073/pnas.1307758110.
Guardian. 2019. Summer heatwaves in France killed 1500, says health minister [article]. Available online https://www.theguardian.com/world/2019/sep/09/summer-heatwaves-in-france.... Accessed 1 Mar 2020.
Jencso K, Parker B, Downey M, Hadwen T, Howell A, Rattling Leaf J, Edwards L, Akyuz A, Kluck D, Peck D, Rath M, Syner M, Umphlett N, Wilmer H, Barnes V, Clabo D, Fuchs B, He M, Johnson S, Kimball J, Longknife D, Martin D, Nickerson N, Sage J, Fransen T. 2019. Flash drought: lessons learned from the 2017 drought across the US northern plains and Canadian prairies [report]. Boulder CO: NOAA, National Integrated Drought Information System. 76 p. Available online https://www.drought.gov/drought/sites/drought.gov.drought/files/NIDIS_LL_FlashDrought_2017_low-res_Final.pdf. Accessed 15 Sep 2019.
Kossin JP, Hall T, Knutson T, Kunkel KE, Trapp RJ, Waliser DE, Wehner MF. 2017: Extreme storms [chapter 9]. In: Wuebbles DJ, Fahey DW, Hibbard, DJ, Dokken DJ, Stewart BC, Maycock TK (eds). 2017 Climate Science Special Report: Fourth National Climate Assessment, Volume I. Washington DC: US Global Change Research Program. p 257-76. Available online https://science2017.globalchange.gov/downloads/CSSR2017_FullReport.pdf. Accessed 12 May 2020.
Marlon J, Howe P, Mildenberger M, Leiserowitz A, Wang X. 2019 (Sep 17). Yale Program on Climate Change Communication; Yale climate opinion maps 2019 [website]. Available online https://climatecommunication.yale.edu/visualizations-data/ycom-us/. Accessed 25 Nov 2019.
Martin C, Doyle J, LaFrance J, Lefthand MJ, Young SL, Three Irons E, Eggers M. 2020. Change rippling through our waters and culture. Journal of Contemporary Water Research and Education 169:61-78.
[MCO] Montana Climate Office. 2019 (April). Montana drought and climate [newsletter]. Available online https://climate.umt.edu/mtdrought/mtdrought-2019-april.pdf. Accessed 15 Sep 2019.
McWethy DB, Schoennagel T, Higuera PB, Krawchuk M, Harvey BJ, Metcalf EC, Schultz C, Miller C, Metcalf AL, Buma B, Virapongse A, Kulig JC, Stedman RC, Ratajczak Z, Nelson CR, Kolden C. 2019. Rethinking resilience to wildfire. Nature Sustainability 2:797-804. doi:10.1038/s41893-019-0353-8.
Metz D, Weigel L. 2016. Montana voter attitudes on energy and conservation in 2016 [slide presentation]. Available online https://climateadvocacylab.org/system/files/57ec4f056ad44.pdf.pdf. Accessed 12 May 2020.
[MTFWP] Montana Fish, Wildlife, and Parks. 2016 (Aug 19). Yellowstone River closed in response to ongoing fish kill [press release]. Available online http://fwp.mt.gov/news/newsReleases/headlines/nr_4277.html. Accessed 1 Mar 2020.
[NASA] National Aeronautics and Space Administration. [undated]. NASA—What's the difference between weather and climate? Available online https://www.nasa.gov/mission_pages/noaa-n/climate/climate_weather.html. Accessed 15 Sep 2019.
[NIDIS] National Integrated Drought Information System. [undated]. Drought.gov: drought in Montana [website]. Available online https://www.drought.gov/drought/states/montana. Accessed 12 May 2020.
[NOAAa] National Oceanic and Atmospheric Administration. [undated]. NOAA, National Centers for Environmental Information: US climate divisions. Available online https://www.ncdc.noaa.gov/monitoring-references/maps/us-climate-divisions.php. Accessed 15 Sep 2019.
[NOAAb] National Oceanic and Atmospheric Administration. [undated]. NOAA, National Centers for Environmental Information: climate at a glance. Available online https://www.ncdc.noaa.gov/cag/statewide/time-series. Accessed 15 Sep 2019.
[NOAAc] National Oceanic and Atmospheric Administration. [undated]. NOAA, National Weather Service: flooding in Montana. Available online https://www.weather.gov/safety/flood-states-mt. Accessed 15 Sep 2019.
[NOAAd] National Oceanic and Atmospheric Administration. [undated]. NOAA, National Centers for Environmental Information: billion-dollar weather and climate disasters: overview. Available online https://www.ncdc.noaa.gov/billions/. Accessed 15 Sep 2019.
[NOAA] National Oceanic and Atmospheric Administration. 2010. Billings tornado of June 20, 2010: overview [internal report]. 3 p. Available online https://www.wrh.noaa.gov/byz/local_news/2010/BillingsTornado10.pdf. Accessed 1 Mar 2020.
Schoennagel T, Balch J, Brenkert-Smith H, Dennison P, Harvey B, Krawchuk M, Morgan P, Moritz M, Rasker R, Turner GG, Whitlock C. 2017. Adapt to more wildfires in western North American forests as climate changes. Proceedings of the National Academy of Sciences 114:4582-90.
Seeley JT, Romps DM. 2015. The effect of global warming on severe thunderstorms in the United States. Journal of Climate 28:2443-58.
Smith E, Ahmed S, Dupuis V, Running Crane M, Eggers M, Pierre M, Flagg K, Byker Shanks C. 2019. Contribution of wild foods to diet, food security, and cultural values amidst climate change. Journal of Agriculture, Food Systems, and Community Development 9(B):191-214. https://doi.org/10.5304/jafscd.2019.09B.011.
Whitlock C, Cross W, Maxwell B, Silverman N, Wade AA. 2017. 2017 Montana Climate Assessment. Bozeman and Missoula MT: Montana State University and University of Montana, Montana Institute on Ecosystems. 318 p. Available online http://montanaclimate.org. Accessed 9 May 2020. doi:10.15788/m2ww82.
[WCRP] World Climate Research Program. [undated]. WCRP climate model intercomparison project [website]. Available online https://www.wcrp-climate.org/wgcm-cmip. Accessed 12 May 2020.