CHAPTER 3
WATER AND CLIMATE CHANGE IN MONTANA
Wyatt F. Cross, John LaFave, Alex Leone, Whitney Lonsdale, Alisa Royem, Tom Patton, and Stephanie McGinnis
Water is the lifeblood of Montana. We depend on an adequate supply of clean water for nearly every aspect of our lives, including food production, hydroelectric power, domestic and industrial uses, and sustaining our treasured natural ecosystems. Water is also strongly influenced by climate, as changes in temperature and precipitation consistently alter patterns of water availability and quality throughout the state. It is thus critical that we understand the impacts of climate change on Montana’s water resources. This chapter synthesizes scientific information on how climate change is influencing the supply and distribution of water in Montana. The information presented here represents an essential first step—understanding what’s changing—within the longer-term, iterative process of adapting and improving our resilience to the challenges of an uncertain climate future.
KEY MESSAGESMontana’s snowpack has declined over the observational record (i.e., since the 1930s) in mountains west and east of the Continental Divide; this decline has been most pronounced since the 1980s. [high agreement, medium evidence]11 Warming temperatures over the next century, especially during spring, are likely to reduce snowpack at mid and low elevations. [high agreement, robust evidence] Historical observations show a shift toward earlier snowmelt and an earlier peak in spring runoff in the Mountain West (including Montana). Projections suggest these patterns are very likely to continue into the future as temperatures increase. [high agreement, robust evidence] Earlier onset of snowmelt and spring runoff will reduce late-summer water availability in snowmelt-dominated watersheds. [high agreement, robust evidence] Long-term (decadal and multi-decadal) variation in total annual streamflow is largely influenced by patterns of climate variability; the influence of climate warming on these patterns is uncertain. [high agreement, medium evidence] Total annual streamflows are projected to increase slightly for most Montana rivers, but the magnitude of change across the state and agreement among models vary. [medium agreement, medium evidence] Local responses of groundwater resources to climate change will depend on whether aquifers are directly sensitive to climate variability, are buffered from climate by water-use practices such as irrigation, or are used to meet water demands that exceed or replace surface water supplies. [high agreement, robust evidence] Groundwater demand will likely increase as elevated temperatures and changing seasonal availability of traditional surface-water sources (e.g., dry stock water ponds or inability of canal systems to deliver water in a timely manner) force water users to seek alternatives. [high agreement, medium evidence] Multi-year and decadal-scale droughts have been, and will continue to be, a natural feature of Montana’s climate [high agreement, robust evidence]; rising temperatures will likely exacerbate drought when and where it occurs. [high agreement, medium evidence] Changes in snowpack and runoff timing will likely increase the frequency and duration of drought during late summer and early fall. [high agreement, medium evidence] A warming climate will strongly influence Montana’s snowpack, streamflow dynamics, and groundwater resources, with far-reaching consequences for social and ecological systems. [high agreement, medium evidence] |
||
INTRODUCTION
Our discussion focuses on climate as a principal driver of change for water resources. However, it is important to note that there are many additional drivers beyond climate, such as population growth and associated changes in land use, that strongly influence our demand for water both now and into the future. Indeed, much of Montana’s water is already fully allocated to various uses (Table 3-1) (Arnell 1999; VörÖsmarty et al. 2000; Montana Department of Natural Resources and Conservation [MT DNRC] 2015), suggesting that creative and collaborative water management strategies will be essential for sustaining abundant and clean water into the future (see Missouri River sidebar).
| Water usage | Annual acre-feet (m3) | % of category |
| Total Water Use | ||
| Hydropower | 72,000,000 (8.9x10¹⁰) | 85.9 |
| Irrigation diversion | 10,395,000 (1.3x10¹⁰) | 12.4 |
| Reservoir evaporation | 1,002,000 (1.2x10⁹) | 1.2 |
| Municipal, stock, industrial, and domestic use | 384,000 (4.7x10⁸) | 0.5 |
| Consumptive Water Uses | ||
| Agricultural irrigation | 2,414,000 (3.0x10⁹) | 67.3 |
| Reservoir evaporation | 1,002,000 (1.2x10⁹) | 28.0 |
| Municipal | 72,000 (8.9x10⁷) | 2.0 |
| Stock water | 42,500 (5.2x10⁷) | 1.2 |
| Thermoelectric | 27,400 (3.4x10⁷) | 0.08 |
| Domestic | 13,900 (1.7x10⁷) | 0.4 |
| Industrial | 10,400 (1.3x10⁷) | 0.03 |
|
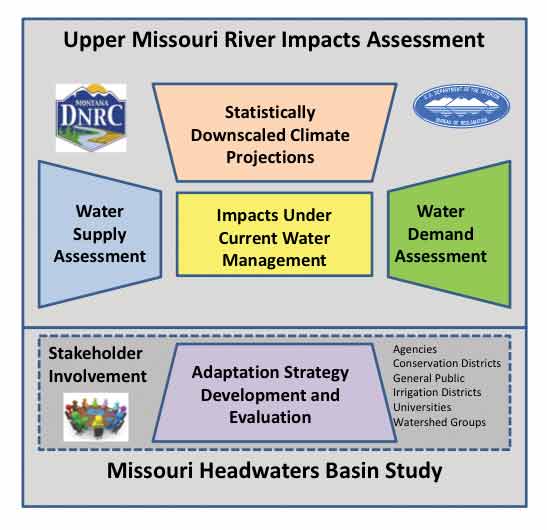
Basin Study of the Missouri River Watershed The current Montana Climate Assessment is focused on understanding relationships between climate change and water resources, with minimal focus on how water use and water management interact with climate. To help advance this important knowledge gap, the Montana Department of Natural Resources and Conservation is partnering with the US Bureau of Reclamation (Reclamation) to conduct a Basin Study of the Missouri River watershed from the headwaters to Fort Peck Reservoir, including the Musselshell River basin (USBR 2014b). Purpose.—The purpose of the Basin Study is to understand potential future changes in basin water supplies and demands, and to analyze possible adaptation strategies for providing water needs into the future. The study builds on Reclamation’s Upper Missouri Impact Assessment (USBR forthcoming) and the Montana State Water Plan (MT DNRC 2015), which evaluate how existing infrastructure would perform under anticipated future conditions. Modeling.—As part of the study, climate and hydrology models will be used to project future water supplies and demands for the Missouri River and its major tributaries. The output from these models will serve as input data to a river-system management model that simulates streamflows, water diversions, water use, return flows, and reservoir operations. Reservoirs simulated in the model include Clark Canyon, Canyon Ferry, Gibson, and Tiber reservoirs, as well as some smaller state and private projects. Desired results.—Output from the river system model is being used to identify likely imbalances in water supply and demand as compared to past and existing operations under known climate and hydrologic conditions. Model output will be used to evaluate adaptation and mitigation strategies including reservoir operational changes, modification of existing facilities, and improved water management. Public participation is a key element of the Basin Study, especially for identifying and developing adaptation strategies.
Text and figure contributed by Larry Dolan (MT DNRC) and Marketa McGuire (US Bureau of Reclamation). |
||
Climate change and the water cycle
The effects of climate change on Montana’s water resources can be best understood by starting with a brief description of the water cycle (Figure 3-1). The water cycle refers to the continuous movement of water from the atmosphere to the Earth’s surface and back, shifting between gaseous (water vapor), liquid, and solid (snow or ice) phases. Each of these phases of the water cycle can be impacted by climate change.
|
|
|
Figure 3-1. Simplified schematic of the water cycle. Artwork by Jenny McCarty. |
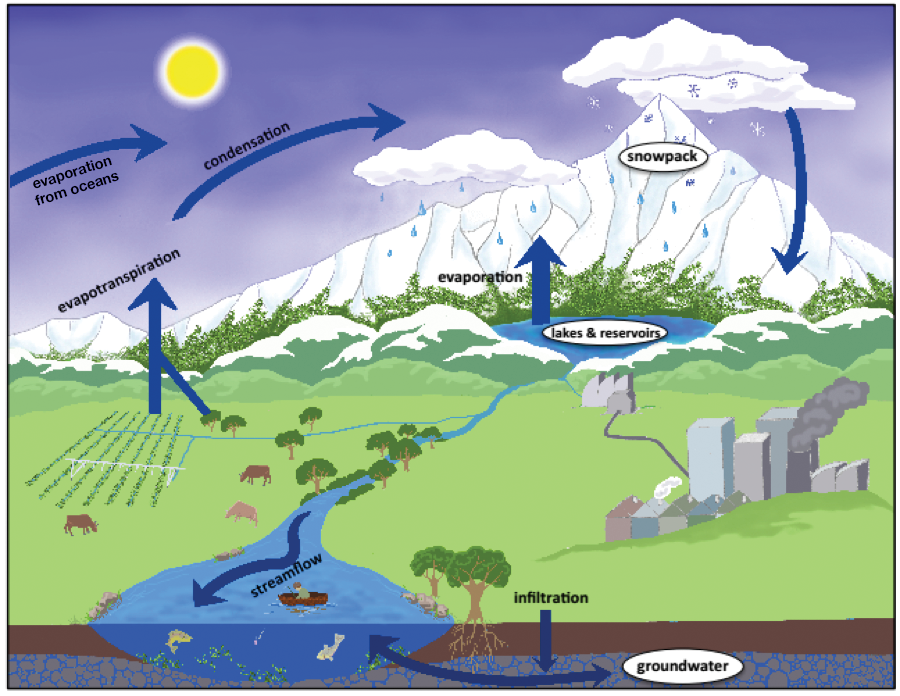
The primary atmospheric source for the water cycle is evaporated water from the ocean. In Montana, much of the winter snowfall that accumulates in the mountains melts in the spring to produce streamflow and recharge groundwater aquifers. This same water supports municipalities and industry throughout the year and is used to irrigate crops in the summer. Some irrigation water will directly support plant growth and some will trickle back into groundwater aquifers. Much of this same water will return to the atmosphere as water vapor through evaporation or plant transpiration, thus completing the water cycle. Precipitation as rainfall is a significant part of the water cycle in Montana, and its contribution to runoff can exceed that of snowfall in prairie environments in the state.
Changes in temperature near the Earth’s surface will have large effects on how water enters Montana (e.g., as rain or snow), how it is distributed among the major storage pools, and how it moves or changes from one component of the water cycle to another. For instance, elevated temperatures can accelerate the loss of snowpack and lead to greater rates of evapotranspiration and the movement of water from the Earth’s surface back to the atmosphere. Additionally, increases in greenhouse gas concentrations and associated warming can affect how efficiently plants use or store water, further influencing important components of the water cycle.
Montana water resources
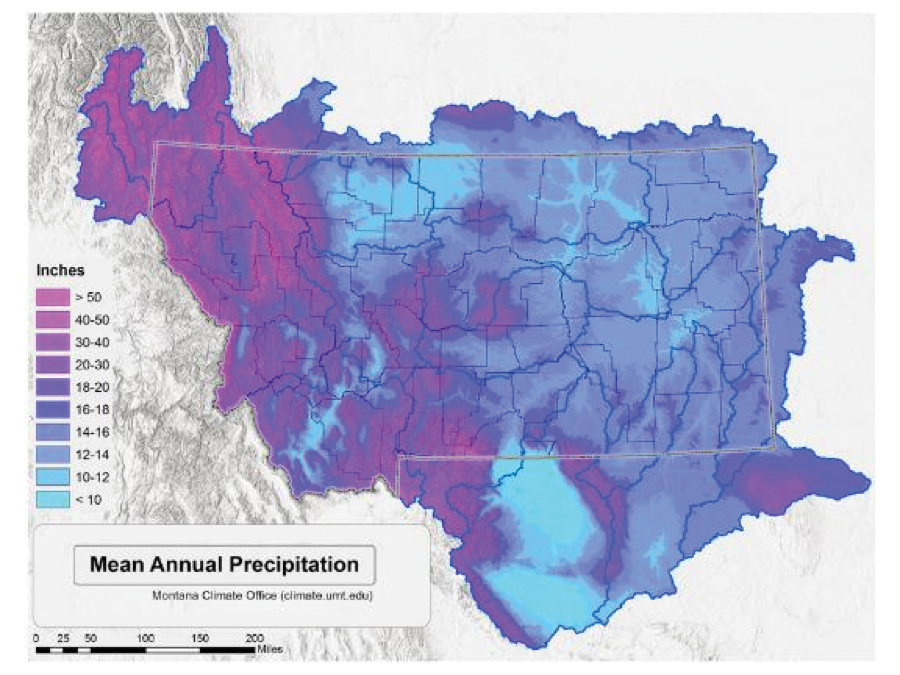
The vast majority of water that enters Montana comes as rain or snow at higher elevations (Figure 3-2) (MT DNRC 2014a, b, c, d; MT DNRC 2015). Although some of Montana’s water originates in Wyoming or adjacent Canadian provinces, over 80% is derived from within state boundaries, hence Montana’s designation as a “headwaters state.”
In a typical year, the majority of western Montana’s precipitation falls as winter snow. This natural bank of water supports Montana’s ecosystems and economies as it melts in the higher elevations and then flows east or west off the Continental Divide. In contrast, much of central and eastern Montana receives the majority of its annual precipitation as spring and summer rains. Thus, a solid understanding of how climate influences a) snowpack in the western portion of the state, and b) rainfall timing and amount in the remainder of the state is essential for making projections about the future of our state’s water supply.
|
|
|
Figure 3-2. Mean annual precipitation for the years 1981-2010 from Daymet. Daymet is produced by the Oak Ridge National Laboratories from methods originally developed at the University of Montana. The data are derived from elevation and daily observations of precipitation in inches from ground-based meteorological stations. Figure courtesy Montana Climate Office. |
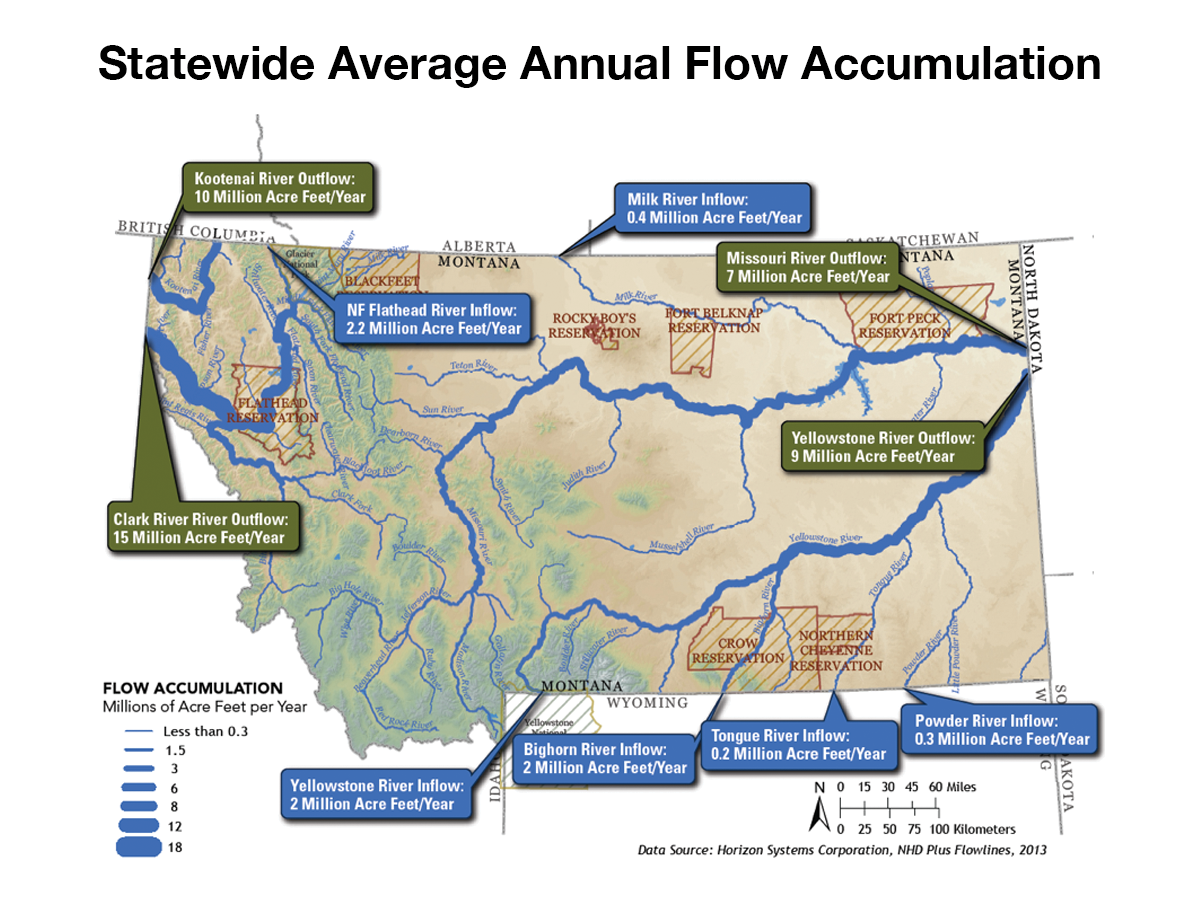
The major rivers of Montana export more than 40 million acre-feet of water/yr (4.9x10¹⁰ m3/yr)12—more than twice the capacity of Flathead Lake—with the majority, approximately 60%, generated in the Clark Fork and Kootenai river basins west of the Continental Divide (Figure 3-3). (MT DNRC 2014a). These western watersheds are considerably smaller than those east of the Continental Divide, but tend to be much wetter because they are more influenced by Pacific Northwest climate patterns. East of the Continental Divide, continental air masses dominate and the climate is generally more arid. Most of the water that leaves the state east of the Continental Divide (approximately 16 million acre-feet/yr [2.0x10¹⁰ m3/yr]) is generated in the Yellowstone and Missouri river watersheds.
|
|
|
Figure 3-3. Statewide average annual flow accumulation as inflows and outflows in millions of acre-feet/yr (1 acre-foot = 1233 m3). Image from the Montana State Water Plan 2015, courtesy of the Montana Department of Natural Resources and Conservation (MT DNRC 2015). |
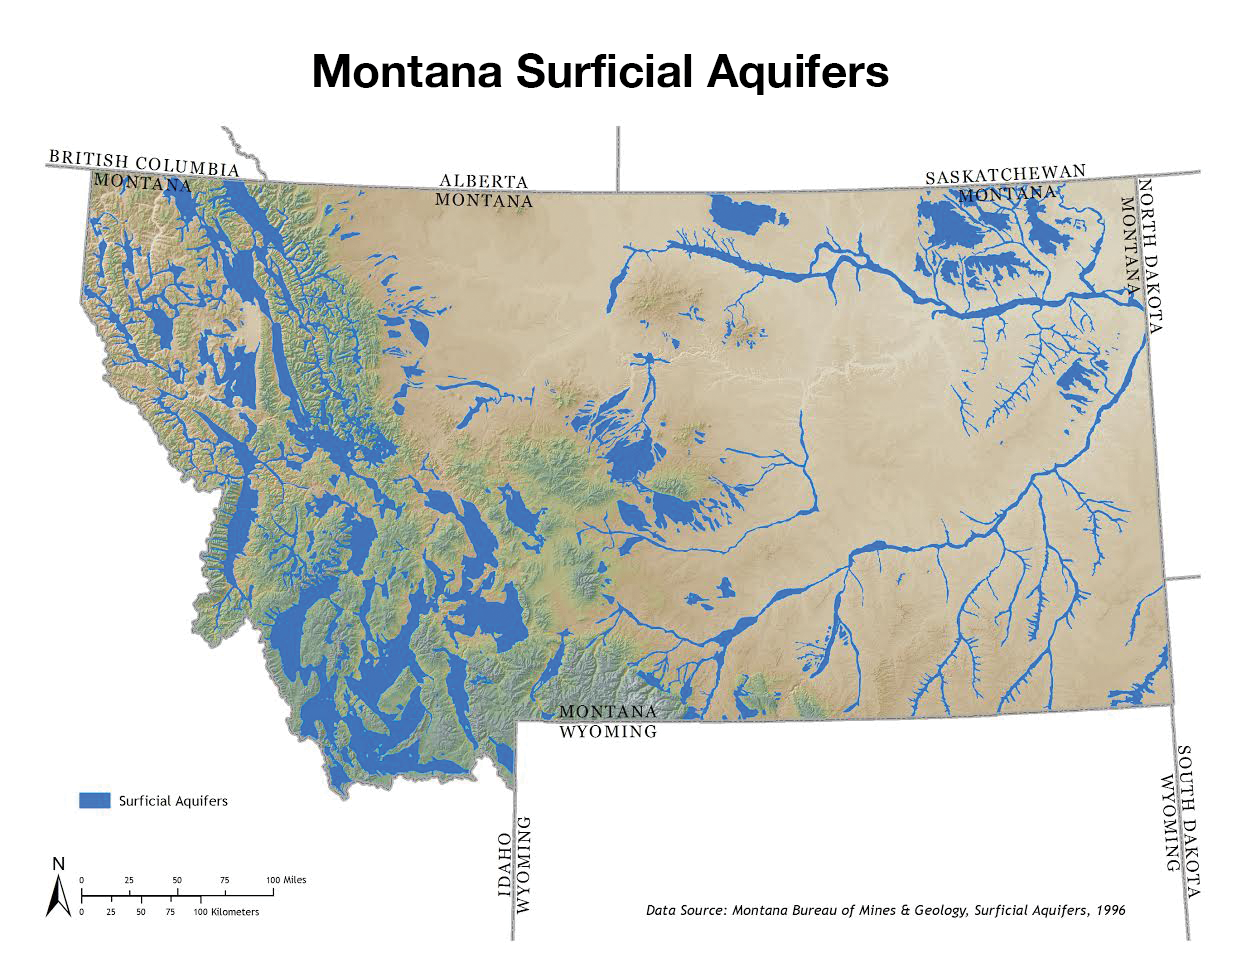
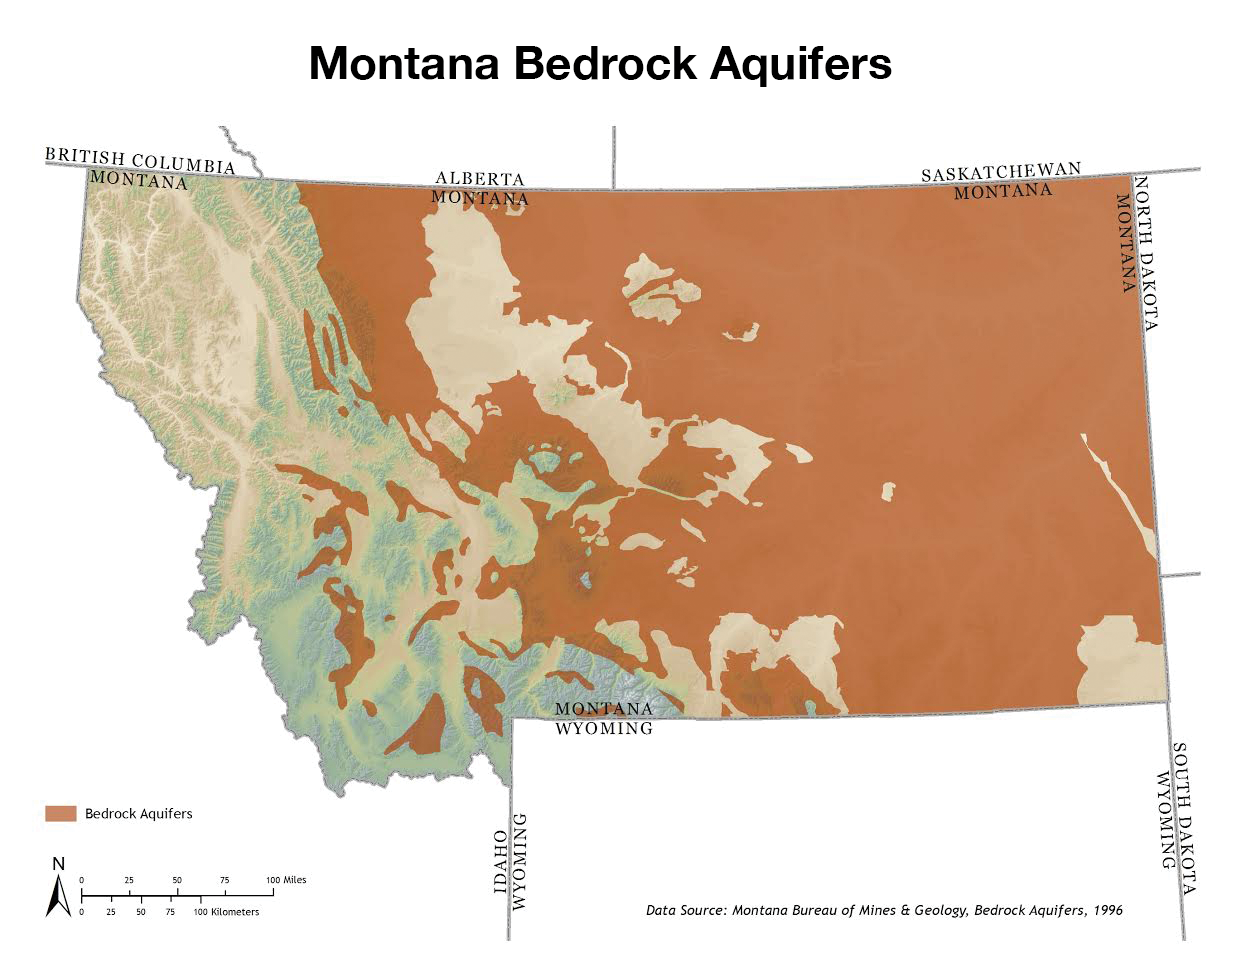
Groundwater is another large and important resource and component of the water cycle in Montana (Figure 3-1). Most of the groundwater used in the state comes from shallow sand or gravel aquifers in river floodplains (Figure 3-4). These sources tend to fluctuate rapidly (days to months) in response to precipitation and evaporation or changes in surface water flow. Other deeper sources of groundwater exist in bedrock aquifers, either where steep mountain fronts meet river valleys (especially in western Montana), or within large subsurface limestone and sandstone rock formations (especially in central and eastern Montana; Figure 3-4).
|
|
|
|
|
Figure 3-4. Distribution of surface-level (i.e., surficial) and bedrock aquifers across Montana. Images from MT DNRC, Montana State Water Plan 2015 (MT DNRC 2015). |
Groundwater resources are critical for water users, but also contribute significantly to natural streamflow throughout the year. Thus, understanding relationships between climate and different types of groundwater resources is important for maintaining Montana’s water security. The Montana Bureau of Mines and Geology tracks long-term groundwater-level change in the state’s principal aquifers (see groundwater section).
Geographic and temporal setting
Montana is the fourth largest state (by land area) in the US and contains substantial topographic variation. As a result, and as previously described (see Climate chapter), climate conditions vary significantly across the state. To best represent the influence of climate variations on water resources, this chapter focuses on eight rivers and their watersheds (Figure 3-5; note that some watersheds—for example, Poplar River and others—extend beyond the state boundaries). These focal rivers and watersheds, chosen across the state’s seven National Oceanic and Atmospheric (NOAA) climate divisions (Figure 2-3),13 include:
- Climate division 1 —Clark Fork River at Saint Regis
—Middle Fork of the Flathead River at West Glacier - Climate division 2 —Missouri River at Toston
- Climate division 3 —Marias River near Shelby
- Climate division 4 —Musselshell River at Mosby14
- Climate division 5 —Yellowstone River at Billings
- Climate division 6 —Poplar River near Poplar
- Climate division 7 —Powder River near Locate
For many of these river basins, both snowpack and streamflow have been recorded by the US Geological Survey (USGS) and the Natural Resources Conservation Service (NRCS) since the 1930s or 1940s. In one instance, the Marias River, streamflow information dates back to the 1910s. These data provide an extensive resource for understanding the historical range of snowpack and streamflow across the state.
|
|
|
Figure 3-5. The focal rivers for this assessment, including black outlines of the seven climate divisions (see Water chapter), contributing watersheds (red), river gage locations (green), and the Continental Divide (dotted). |
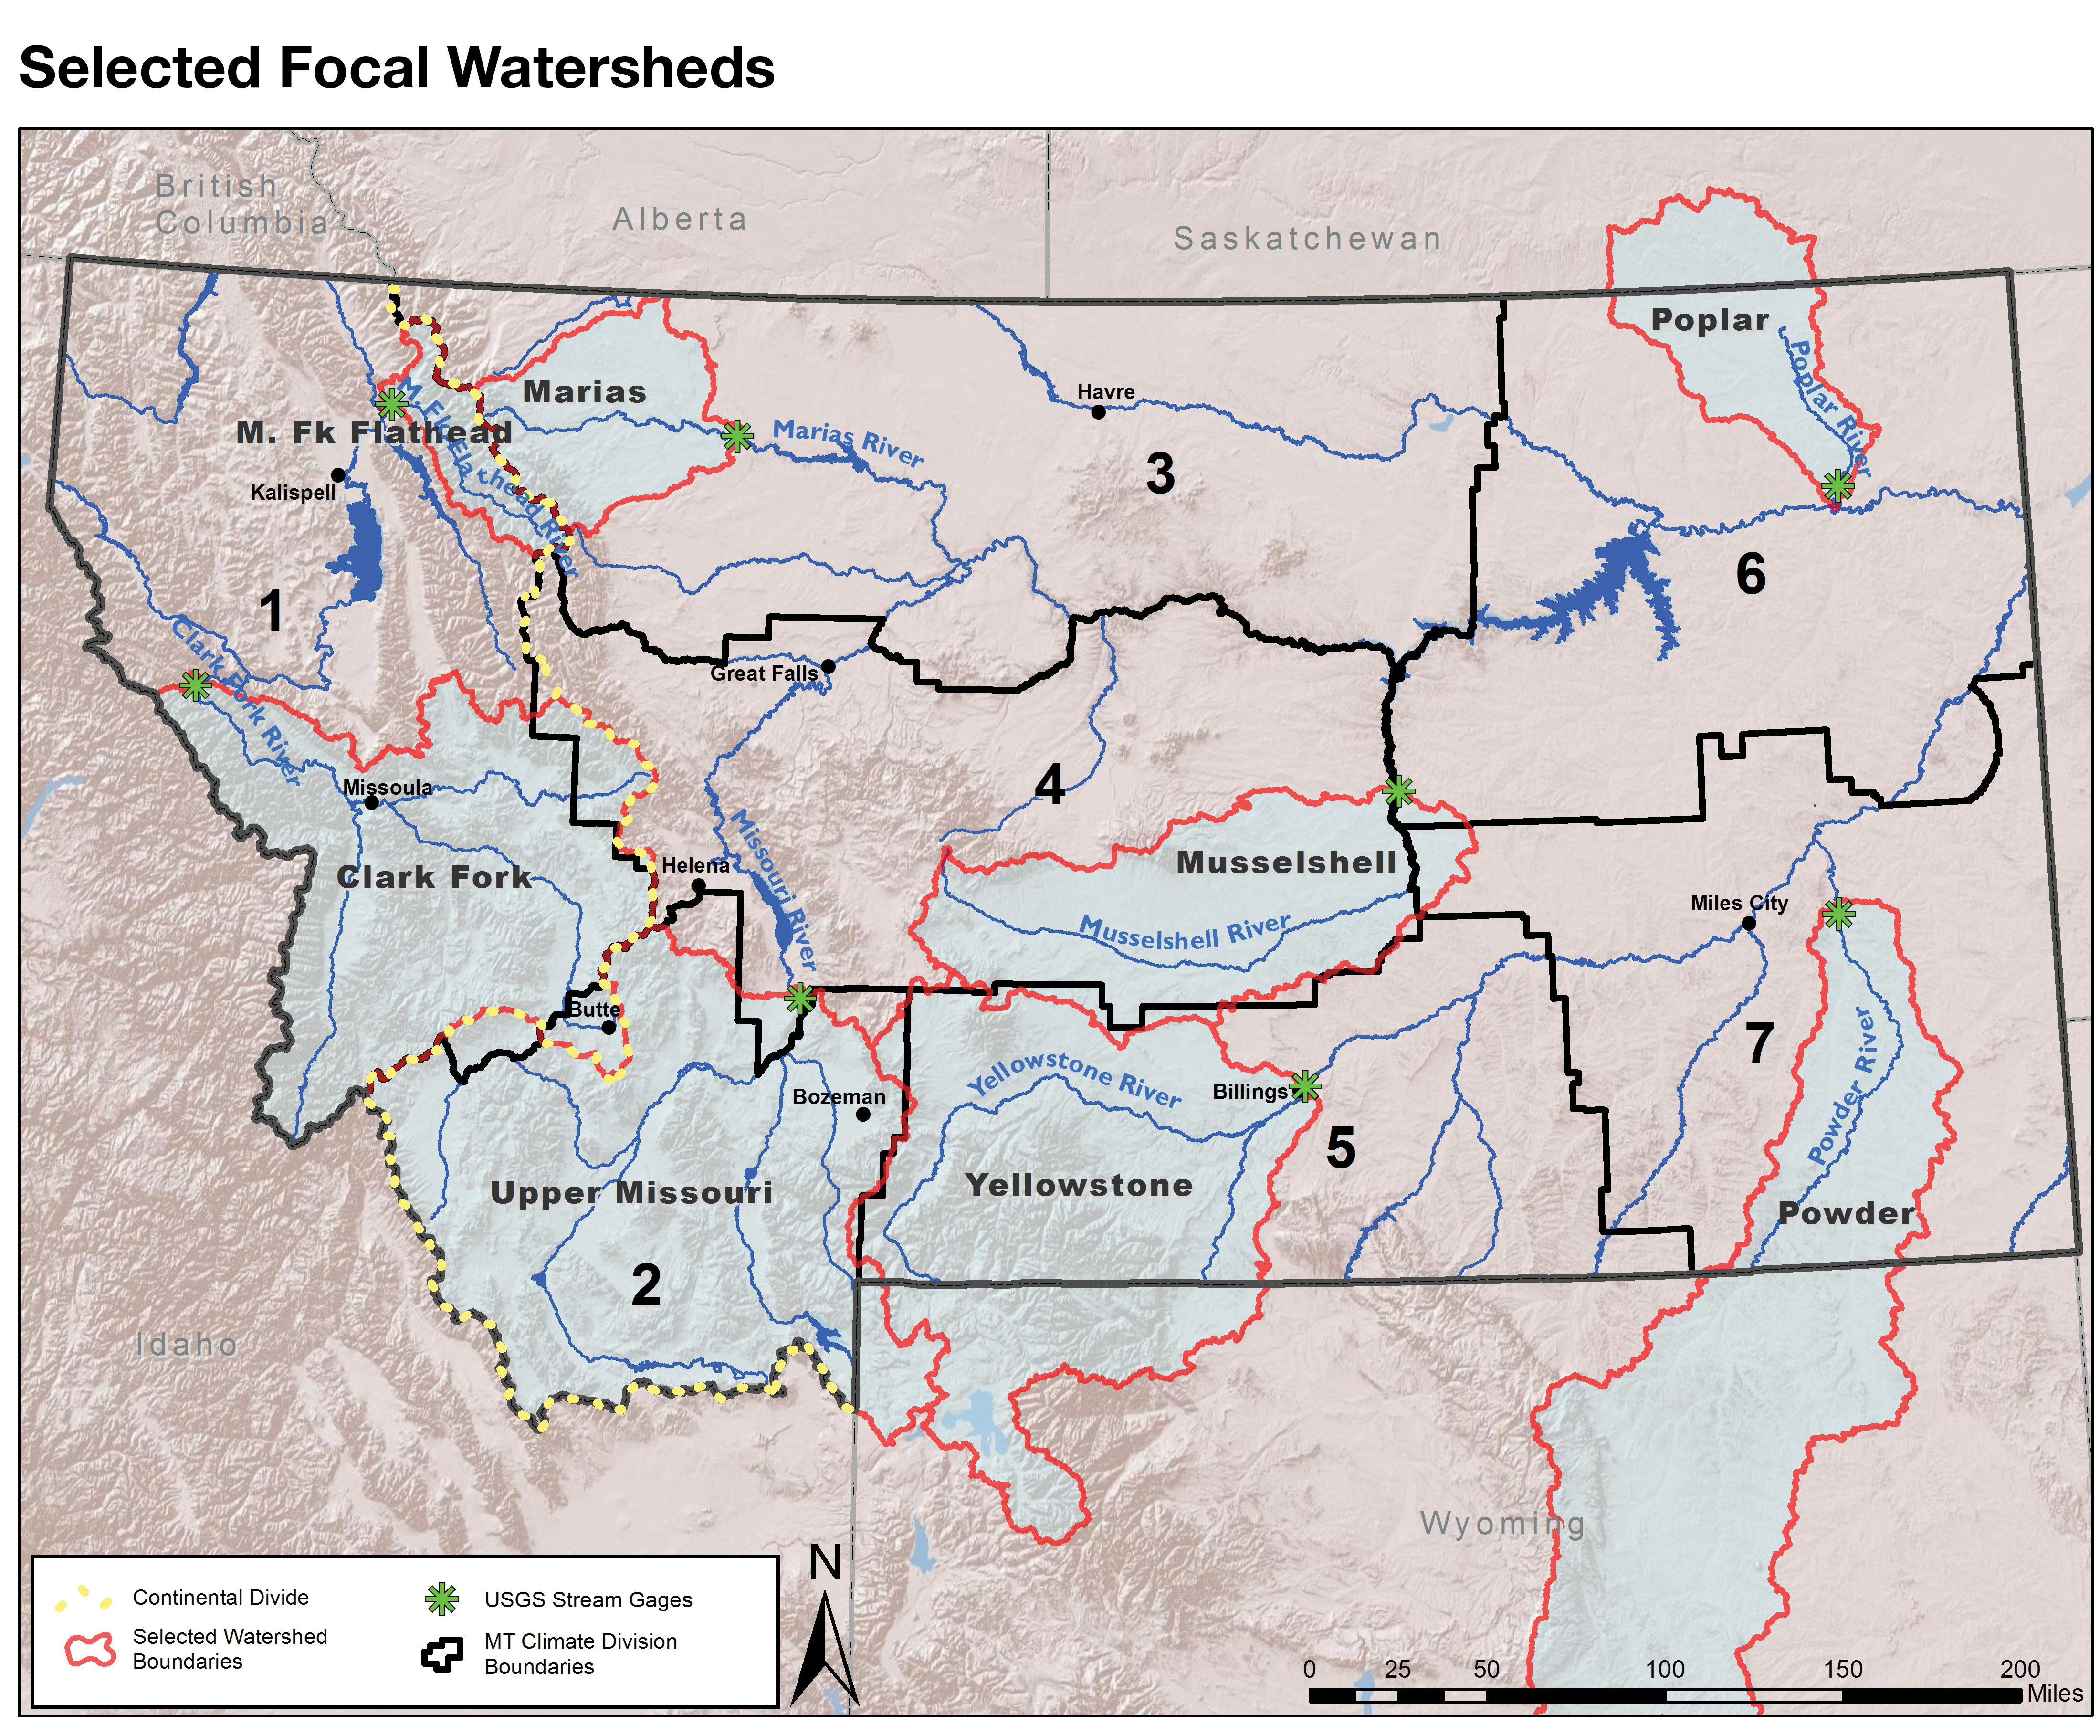
Our focal rivers were selected to represent differences in streamflow regimes across Montana’s climate divisions. Individual USGS stream gaging stations were selected based on two principal criteria:
- at least 70 yr of streamflow data (preferably continuous), and
- low to moderate upstream water use or levels of water development representative of the region (note that the vast majority of rivers in Montana are influenced to some degree by water use, and these data do reflect some human modification).
Patterns of streamflow for large rivers in Montana reflect a general dependence on snowpack and snowmelt, with peak flows typically occurring in the spring and low flows occurring in late summer and persisting through the fall and winter. However, the magnitude and timing of runoff vary among rivers across Montana, resulting largely from variation in watershed elevation and the seasonal distribution of precipitation as snow or rain. Changes in river levels are measured by hydrographs. Within our representative sample of Montana rivers, three predominant hydrograph patterns are evident (Figure 3-6): snowmelt-dominated, dual-peaked, and low-elevation plains.
|
|
|
Figure 3-6. Streamflow patterns throughout the year for our focal rivers, including the average, 10th percentile, and 90th percentile flow for the long-term periods of record. Flow is in cubic feet per second or CFS (metric unit is m3/s). |
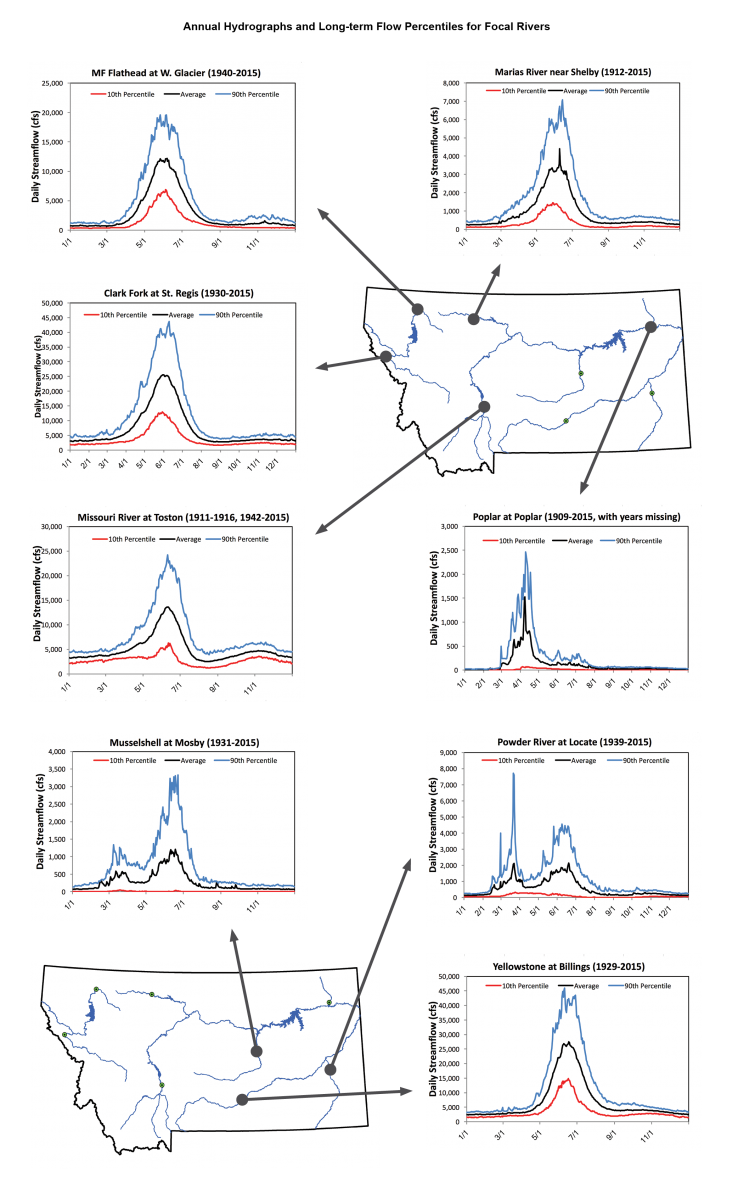
Snowmelt-dominated hydrograph.—The vast majority of rivers in western and central Montana are classified as snowmelt dominated. Representative snowmelt-dominated rivers in Montana include the Middle Fork of the Flathead River at West Glacier, the Clark Fork River at Saint Regis, the Yellowstone River at Billings, the Missouri River at Toston, and the Marias River near Shelby.
Winter and spring precipitation, coupled with seasonal patterns of solar radiation, heavily influence streamflow in these rivers. Warming temperatures in March and April initiate the snowmelt process, driving a significant rise in the hydrograph (Figure 3-6). Spring precipitation (as rain) and additional rapid snowmelt, with a large peak in flows during May or June, further augment streamflow. Snowmelt recession then gives way to low base flow that dominates for the remainder of the year (typically late fall to early spring).
Variations within this category occur. Spring runoff in snowmelt-dominated rivers west of the Continental Divide often starts and peaks a few weeks earlier than those to the east. The earlier runoff results because of generally warmer temperatures and lower elevations (e.g., compare the warmer and lower-elevation Clark Fork River at Saint Regis to the Yellowstone River at Billings). In contrast, snowmelt and peak flow tend to lag for snowmelt-dominated rivers at high elevations and with north-facing slopes due to cooler temperatures.
Several snowmelt-dominated rivers in Montana, particularly in agriculturally dominated basins, exhibit a small increase in streamflow during September and October. This pattern can be attributed to the end of the irrigation season, fall precipitation, residual groundwater return flows from irrigated areas, and a general reduction in plant evapotranspiration. The Missouri River at Toston, for example, demonstrates such a pattern (Figure 3-6).
Dual-peaked hydrograph.—Some Montana rivers are fed by a combination of high- and low-elevation snowpack, creating an annual hydrograph with two distinct peaks. These rivers are generally located in the central and eastern parts of the state, for example the Musselshell River at Mosby and the Powder River near Locate (Figure 3-6). The earlier streamflow peak, centered in March-April, results from early snowmelt as low-elevation prairies thaw. The second hydrologic peak, generally occurring in June, results from snowmelt and precipitation at higher elevations. As in the snowmelt-dominated hydrographs, streamflow then declines throughout the summer, reaching base flows in August or September.
Low-elevation plains hydrograph.—Low-elevation watersheds, also largely located in central and eastern Montana, show more erratic spring flows, as well as far greater interannual variation due to the predominant influence of rain instead of snowmelt. Streamflow in these rivers typically begins to rise in February or March, peaks in April, and recedes by the end of May, with small increases in summer streamflow due to localized rain events. This type of runoff pattern is only evident among plains watersheds without mid- or high-elevation headwaters, such as the Poplar River watershed at Poplar (Figure 3-6). Hydrographs of larger rivers in the eastern part of the state, such as the lower Yellowstone and Missouri rivers, are influenced more strongly by high-elevation snowmelt in the headwaters, and therefore do not follow the low-elevation plains pattern.
We can expect that climate change will have varying effects on these different categories of streams, which we address below.
Future projections
Climate models (see Climate chapter) provide a method for projecting future climate scenarios in Montana. By linking climate models to water cycle models, we can also generate projections about how climate change is likely to influence Montana’s water resources.
This chapter presents climate model-based hydrologic projections of snowpack and streamflow for our eight focal river basins. These projections derive from a national modeling effort undertaken by a large collaborative team of agencies, universities, and research centers (LLNL undated). The models employed herein were also used by the Intergovernmental Panel on Climate Change (Stocker et al. 2013) and the National Climate Assessment (Melillo et al. 2014).
Hydrologic projections reported in this chapter comprise 31 complementary general circulation models that were downscaled using the Bias-Correction Spatial Disaggregation technique and incorporated into the Variable Infiltration Capacity hydrologic model (USBR 2014a). All of the models employed include some level of uncertainty that informs how much we should trust the results. For example, hydrologic models are linked to the water cycle and climate-related changes in certain elements of the water cycle, such as evapotranspiration, can be particularly difficult to quantify. The hydrologic projections in this assessment are compared to a baseline period of 1970-2000. These baseline streamflows are also generated by the model and may differ from actual historical flow data. Our analysis focuses on relative changes in flow, rather than absolute streamflow values. Any future assessments aiming to offer precise estimates of projected streamflow volumes will need to undergo a model calibration process (USBR 2016).
Throughout the chapter we use the following convention to represent model agreement for the hydrologic projections:
- Very high confidence.—If all the models agree on the direction (positive or negative) of a particular outcome (e.g., reduced April 1 snowpack).
- High confidence.—80% of the models agree.
- Low confidence.—60% of the models agree.
- No confidence.—If 50% of the models show one result (e.g., a future increase in snowpack) and 50% show the other (e.g., a future decrease in snowpack), we have virtually no confidence in the future projection.
Chapter organization
In the remainder of this chapter, we discuss how climate change will affect key parts of the water cycle. The focal areas discussed in the remainder of this chapter are:
- Snowpack.—We examine how changes in climate have influenced snowpack in Montana and the region; and we present model projections for snowpack in the future.
- Snowmelt and Runoff Timing.—We show historical trends in snowmelt and runoff timing; examine climate factors that most influence these patterns; and present model projections for stream runoff in the future.
- Annual Streamflow.—We examine historical trends in total annual streamflow; discuss what climate factors most influence these patterns; and present model projections for the future.
- Groundwater Resources.—We discuss how climate change and groundwater resources interact across the state.
- Drought.—We present factors that influence long-term persistent drought, as well as seasonal low flows in summer months; and we explore how drought risk might change in the future.
|
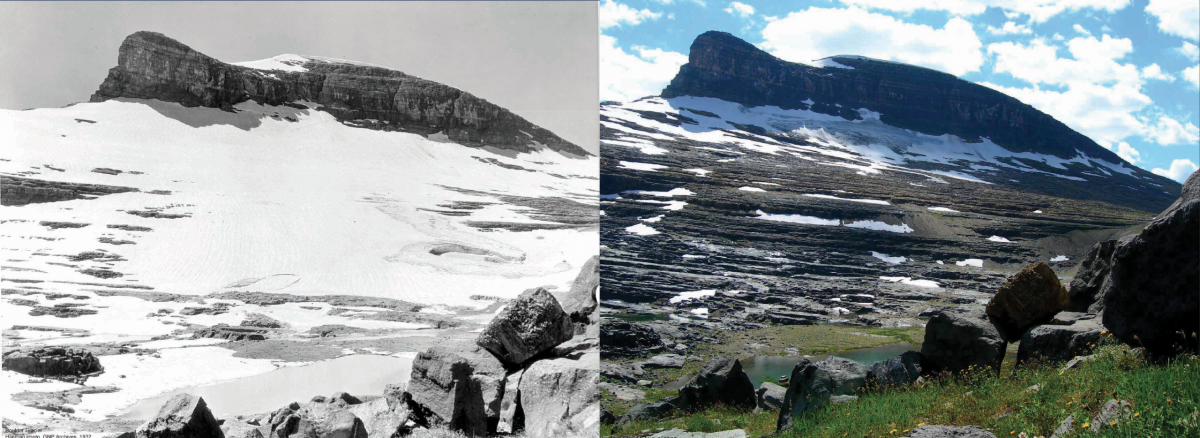
Montana’s Disappearing Glaciers Glaciers are slowly moving masses of ice formed by the accumulation and compaction of snow. The loss of Montana glaciers—a visible local example of climate warming—is an important bellwether of a broader set of changes to Montana’s water cycle. Changes to the water cycle are expected to have far-reaching effects on human and natural systems (IPCC 2014). Increasing temperatures.—Elevated greenhouse gas concentrations have led to an increase in average temperatures throughout Montana (see Climate chapter). It is likely that this trend will continue into the future. Decreasing glaciers.—One of the most visible manifestations of climate warming in Montana is the rapid melting of the last remaining glaciers in Glacier National Park. A repeat photography project conducted by the USGS highlighted the dramatic changes over the past 150 yr (photos). When geologists first surveyed Glacier National Park in the 1850s, approximately 150 glaciers existed; at present, only 25 of these glaciers or ice fields remain (Chaney 2016). Most concerning is the fact that these changes have occurred over a relatively short period, with the majority of glacial melt occurring since the 1980s (Pederson et al. 2011b). Scientists predict that the vast majority of glacial ice in Glacier National Park will disappear within the next 20 yr (USGS 2016). What is driving the loss of permanent ice from Glacier National Park? Researchers have attributed glacial decline to increasing temperatures, which have reduced the period of glacial accumulation and extended the period of summer ice melting (ablation). The result is a net loss of ice over time (Hall and Fagre 2003; Pederson et al. 2004). Other studies have similarly described the decline of glaciers and snowfields in the Northern Rockies and Pacific Northwest (e.g., Mote et al. 2005; Moore et al. 2009; Nolin et al. 2010), suggesting that this pattern is much larger in scale than Glacier National Park.
Repeat photographs of Boulder Glacier in Glacier National Park. The photos are from 1932 (left) and 2005 (right). Courtesy of USGS Northern Rocky Mountain Science Center. |
SNOWPACK
Key Message
Montana’s snowpack has declined over the observational record (i.e., since the 1930s) in mountains west and east of the Continental Divide; this decline has been most pronounced since the 1980s. Warming temperatures over the next century, especially during spring, are likely to reduce snowpack at mid and low elevations. [high agreement, robust evidence]
The influence of climate on snowpack is one of the major linkages between climate change and water supply. Snowpack in the mountains of Montana stores and provides water to downstream users and ecosystems in both the US and Canada. Water generated by Montana’s snowpack travels to the Pacific, Atlantic, and Arctic oceans. Indeed, western Montana is often called the Crown of the Continent because headwater streams originating there give rise to the major rivers that drain three of North America’s largest watersheds, those of the Columbia, Missouri-Mississippi, and Saskatchewan rivers.
Precipitation that falls at higher elevations during the cold winter months accumulates as snow until spring when temperatures increase and snowmelt begins. In Montana’s mountainous areas, winter snowfall represents the majority (62-65%) of total annual precipitation (Serreze et al. 1999), while in the eastern plains, the contribution of snowfall to total precipitation is considerably less (WRCC undated). All of Montana’s major rivers that contain headwaters above 7000 ft (2100 m) elevation are considered snowmelt-dominated systems in which precipitation as snow is a primary driver of year-to-year variability in streamflow. This snowpack acts as a natural reservoir, slowly releasing water during the spring and early summer, sustaining approximately 2 million acres (0.8 million ha) of irrigated farmland in Montana (Pierce et al. 2008; Vano et al. 2010; USDA-NASS 2015). A sufficient supply of water (especially during the summer) is not only important for maintaining Montana’s agricultural industry, but it also underpins our natural ecosystems and the state’s rapidly growing tourism economy (Power and Power 2015, 2016).
Most of Montana’s annual snowfall arrives from mid October through mid May (although snowfall has been observed in all 12 months in the mountains of Montana). Snowfall is strongly influenced by local and regional climate. Average annual snowfall varies considerably throughout the state, from roughly 20 inches (0.5 m) in the plains of northeastern Montana, to over 400 inches (10.1 m) in several mountain locations in the west (WRCC undated). (Note that annual snowfall totals are higher than annual precipitation totals—as in Figure 3.2—because of the different physical properties of frozen versus liquid water).
Measuring snowpack
Reliable snowpack measurements are essential for estimating water supply and assessing the risk of drought or floods (MT DNRC undated). The US Department of Agriculture’s (USDA’s) Natural Resources Conservation Service (NRCS undated) measures Montana’s snowpack through two networks:
- Over 90 automated SNOwpack TELemetry (SNOTEL) sites.—First established in Montana during the early-1970s, SNOTEL sites gather high-resolution data year-round, and remotely transmit snowpack and climate information every hour.
- Roughly 100 Snow Course survey locations.—First established in Montana in the 1920s-1960s, Snow Course data consist of hand-collected snowpack measurements. These measurements, typically gathered near the first of each winter month, provide our longest direct records of regional snowpack.
Scientists usually report snowpack as snow water equivalent (SWE). SWE represents the amount of liquid water contained within a column of snow or, more precisely, the height of water that would remain in a standardized area if the snowpack melted. When examining multi-year trends in snowpack, scientists and managers often use the April 1 SWE measurement to represent peak snowpack and total accumulated cold-season precipitation. Although April 1 SWE values can underestimate actual peak snowpack in the Northern Rockies (Bohr and Aguado 2011), this metric functions as a reasonable approximation for maximum snowpack at the watershed scale (Serreze et al. 1999; Pederson et al. 2011b) and as an indicator of potential spring streamflow in Montana.
April 1 is considered an optimal date for examining trends because it is the most continuously collected date in the observational record; some sites have been recorded continuously for over 80 yr (Mote et al. 2005).
Montana’s diverse geography and topography influence patterns of snowpack accumulation and snowmelt
Geography.—In Montana, the Continental Divide exerts a marked influence on climate patterns and resulting snowpack:
- Areas west of the Continental Divide typically exhibit milder winters, cooler summers, and a longer growing season due to the influence of warm Pacific air masses (see Climate chapter). Figure 3-2 shows that average annual precipitation is highest west of the Continental Divide (MT DNRC 2015). As a result, total water yields and water yield relative to watershed area are greatest in climate division 1 (Figure 3-5) (MT DNRC 2015).
- Areas east of the Continental Divide experience more extreme seasonal temperature fluctuations and a shorter growing season due to greater influence by drier continental air masses (see Climate chapter) (WRCC undated).
Topography.—Mountains west of the Continental Divide are generally situated at lower elevations than those east of the Continental Divide, yet the western mountains still receive more snowfall on average each year (Figure 3-2). SNOTEL stations record the highest snowfall totals west of the Continental Divide in the Kootenai, Flathead, and Clark Fork basins. Several of these stations are located at relatively low elevations (5000-6500 ft [1500-1980 m]), but receive over 40 inches (1 m) of SWE each year. By comparison, the highest annual snowpack totals east of the Continental Divide (20-35 inches [0.5-0.9 m] of SWE) are generally located at elevations over 8000 ft (2400 m) (NRCS 2016).
For most mountainous areas in Montana, SWE typically peaks in April or early May, but this can vary depending on elevation, aspect (e.g., north versus south facing), and relative position west or east of the Continental Divide. Low-elevation SNOTEL sites west of the Continental Divide in the Kootenai Basin (approximately 4200 ft [1280 m]) typically record maximum snowpack at the end of March and snow is absent by early May. In contrast, high-elevation sites (over approximately 8500 ft [2590 m]) in the headwaters of the Yellowstone and Missouri basins exhibit peak SWE values in mid May, and some north-facing slopes can retain snow through the end of June (NRCS 2016).
Snowpack accumulated at high elevations tends to be more stable and persist longer than at low elevations, largely as a result of colder temperatures at high elevations. Snowpack at higher elevations is also less prone to melt during short warm spells in the early spring that can degrade snowpack at lower elevations.
Long-term variation in snowpack and the importance of ocean-atmosphere linkages
As discussed in the Climate chapter, large-scale atmospheric patterns associated with changes in sea-surface temperatures are largely responsible for variation in Montana’s weather and climate (Cayan et al. 1998; Abatzoglou 2011; Pederson et al. 2011a; Pederson et al. 2013a). Phase shifts in the Pacific Decadal Oscillation can be readily detected in the long-term records of annual snowfall. On shorter time scales, and layered on top of Pacific Decadal Oscillation variation, the Pacific North American pattern and the El Niño-Southern Oscillation cycles (see Climate chapter) can also affect variation in snowpack. During El Niño episodes, Montana tends to experience warmer-than-average temperatures and below-average precipitation, especially during the winter and spring. These anomalies decrease snowpack and result in early snowmelt (Climate Prediction Center 2016). In contrast, La Niña episodes typically result in below-average temperatures, above-average precipitation, and above-average snowpack. Exceptions to these patterns certainly exist.
Observed regional trends in snowpack
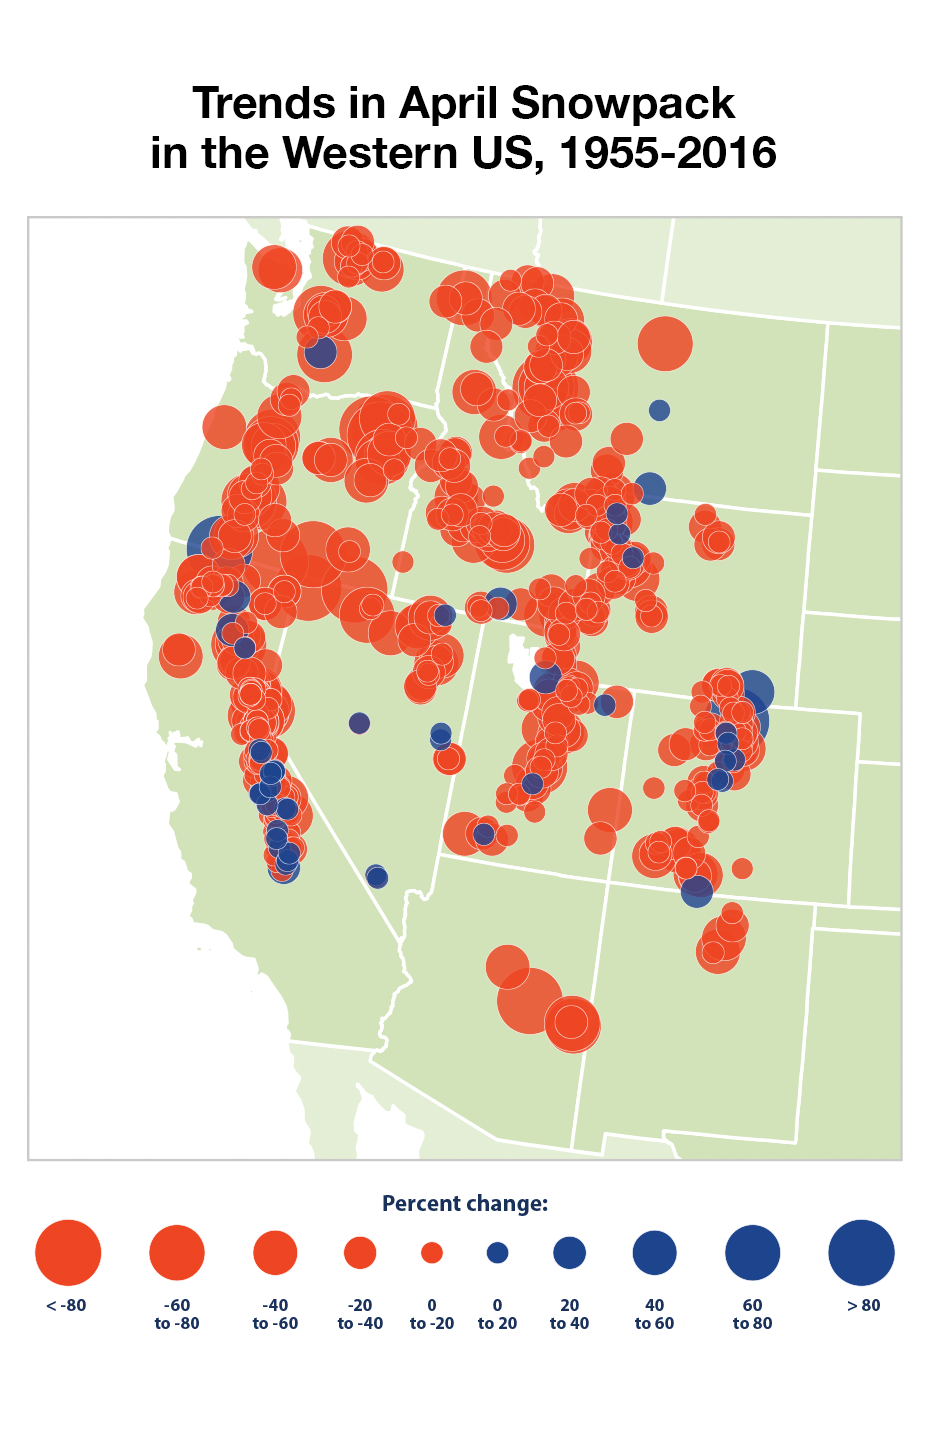
Regional trends in April 1 SWE demonstrate that average annual snowpack has declined in large portions of the American West over the period of reliable measurement (1930s to present; Figure 3-7) (Mote 2003; Hamlet et al. 2005; Mote 2006; Casola et al. 2009; Mote and Sharp 2016). Some regions, such as low-elevation sites in the northern Rocky Mountains (including Montana) and the Cascades, have experienced more drastic reductions than other sites, such as high-elevation loctions in the Sierras and central Rocky Mountains.
|
|
|
Figure 3-7. Trends in April snowpack in the western US, 1955-2016. Red bubbles indicate areas with declining snowpack; blue bubbles indicate areas with increasing snowpack. The diameter of the bubbles is proportional to the percentage change between 1955 and 2016. Figure from Mote and Sharp (2016). |
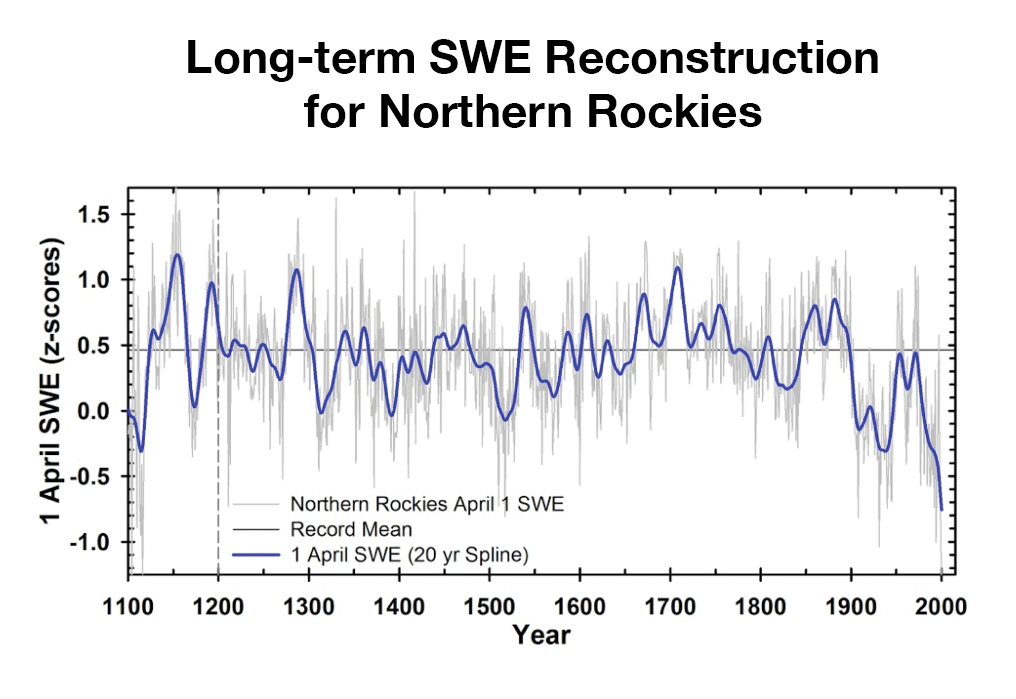
However, it is important to place these recent observations in the context of much longer-term (multi-century) changes in climate. Climate reconstructions based on tree-ring measurements provide a robust tool for producing quantitative comparisons of past and present climate (Fritts 2012). One such recent reconstruction showed that declines in snowpack since the 1950s are unusually severe and synchronous across the West when viewed in the context of the past 1000 yr (Figure 3-8) (Pederson et al. 2011b). Separate studies have suggested that these recent declines in snowpack can be directly attributed to elevated greenhouse gas emissions and associated warming (Barnett et al. 2008; Pierce et al. 2008).
|
|
|
Figure 3-8. Snow water equivalent (SWE) reconstruction for the Northern Rockies based on tree-ring measurements (figure from Pederson et al. 2013a). Z-scores standardize the data to represent the number of standard deviations above or below the long-term average. |
In the Rocky Mountains, spring (February-March) warming since the 1980s has been largely responsible for recent snowpack declines at mid- and low-elevation sites (Pederson et al. 2013b). Most studies agree that general declines in snowpack across the West have resulted from warming spring temperatures (Mote 2003; Hamlet et al. 2005; Mote et al. 2005; Abatzoglou 2011; Kapnick and Hall 2012; Pederson et al. 2013a; Lute et al. 2015); however, declines in winter precipitation may also be important (Clow 2010). If spring temperatures continue to warm as projected (see Climate chapter), snowpack is likely to decline even further.
Observed trends in Montana’s snowpack
We conducted an updated assessment of Montana’s April 1 SWE to assess variability and trends over the full record—from the late 1930s to present—of NRCS Snow Course observations.15 We used Snow Course rather than SNOTEL data because of its longer period of record. Although studies have shown a strong correlation between Snow Course and SNOTEL April 1 SWE measurements (Serreze et al. 1999; Bohr and Aguado 2001; Dressler et al. 2006; Pederson et al. 2011a), all snowpack measurements have limitations, including the potential for human measurement error, land-use change over the period of record, poor representation for watersheds with highly complex terrain, and misrepresentation of high-elevation sites that lack measurement stations (Gillan et al. 2010; Silverman and Maneta 2016). Nonetheless, Snow Course trends are more dependable and useful for describing long-term changes to snowpack across Montana’s large mountainous watersheds.
Long-term cycles in April 1 SWE are evident among all Snow Course groupings (Figure 3-9). These cycles can be attributed in part to decadal-scale climate patterns, including the Pacific Decadal Oscillation. For example, the Pacific Decadal Oscillation was in a negative phase between approximately 1960-1980, leading to above average snowpack across the state. In contrast, from the mid 1980s through approximately 2000, a positive phase led to relatively low snowpack years (Figure 3-9).
Large interannual variability in snowpack can be nested within Pacific Decadal Oscillation (and Pacific North American) driven patterns (e.g., see the high snow years of 1996 and 1997 that occurred during a 25-year period of below average snowpack).
|
|
|
Figure 3-9. Normalized April 1 SWE based on Snow Course measurements west and east of the Continental Divide. The upper panel in each column shows data summarized from all Snow Course stations west or east of the Continental Divide. The middle and lower panels show patterns of SWE at high or lower elevations. Black lines represent simple downward trends and are not meant for statistical inference. |
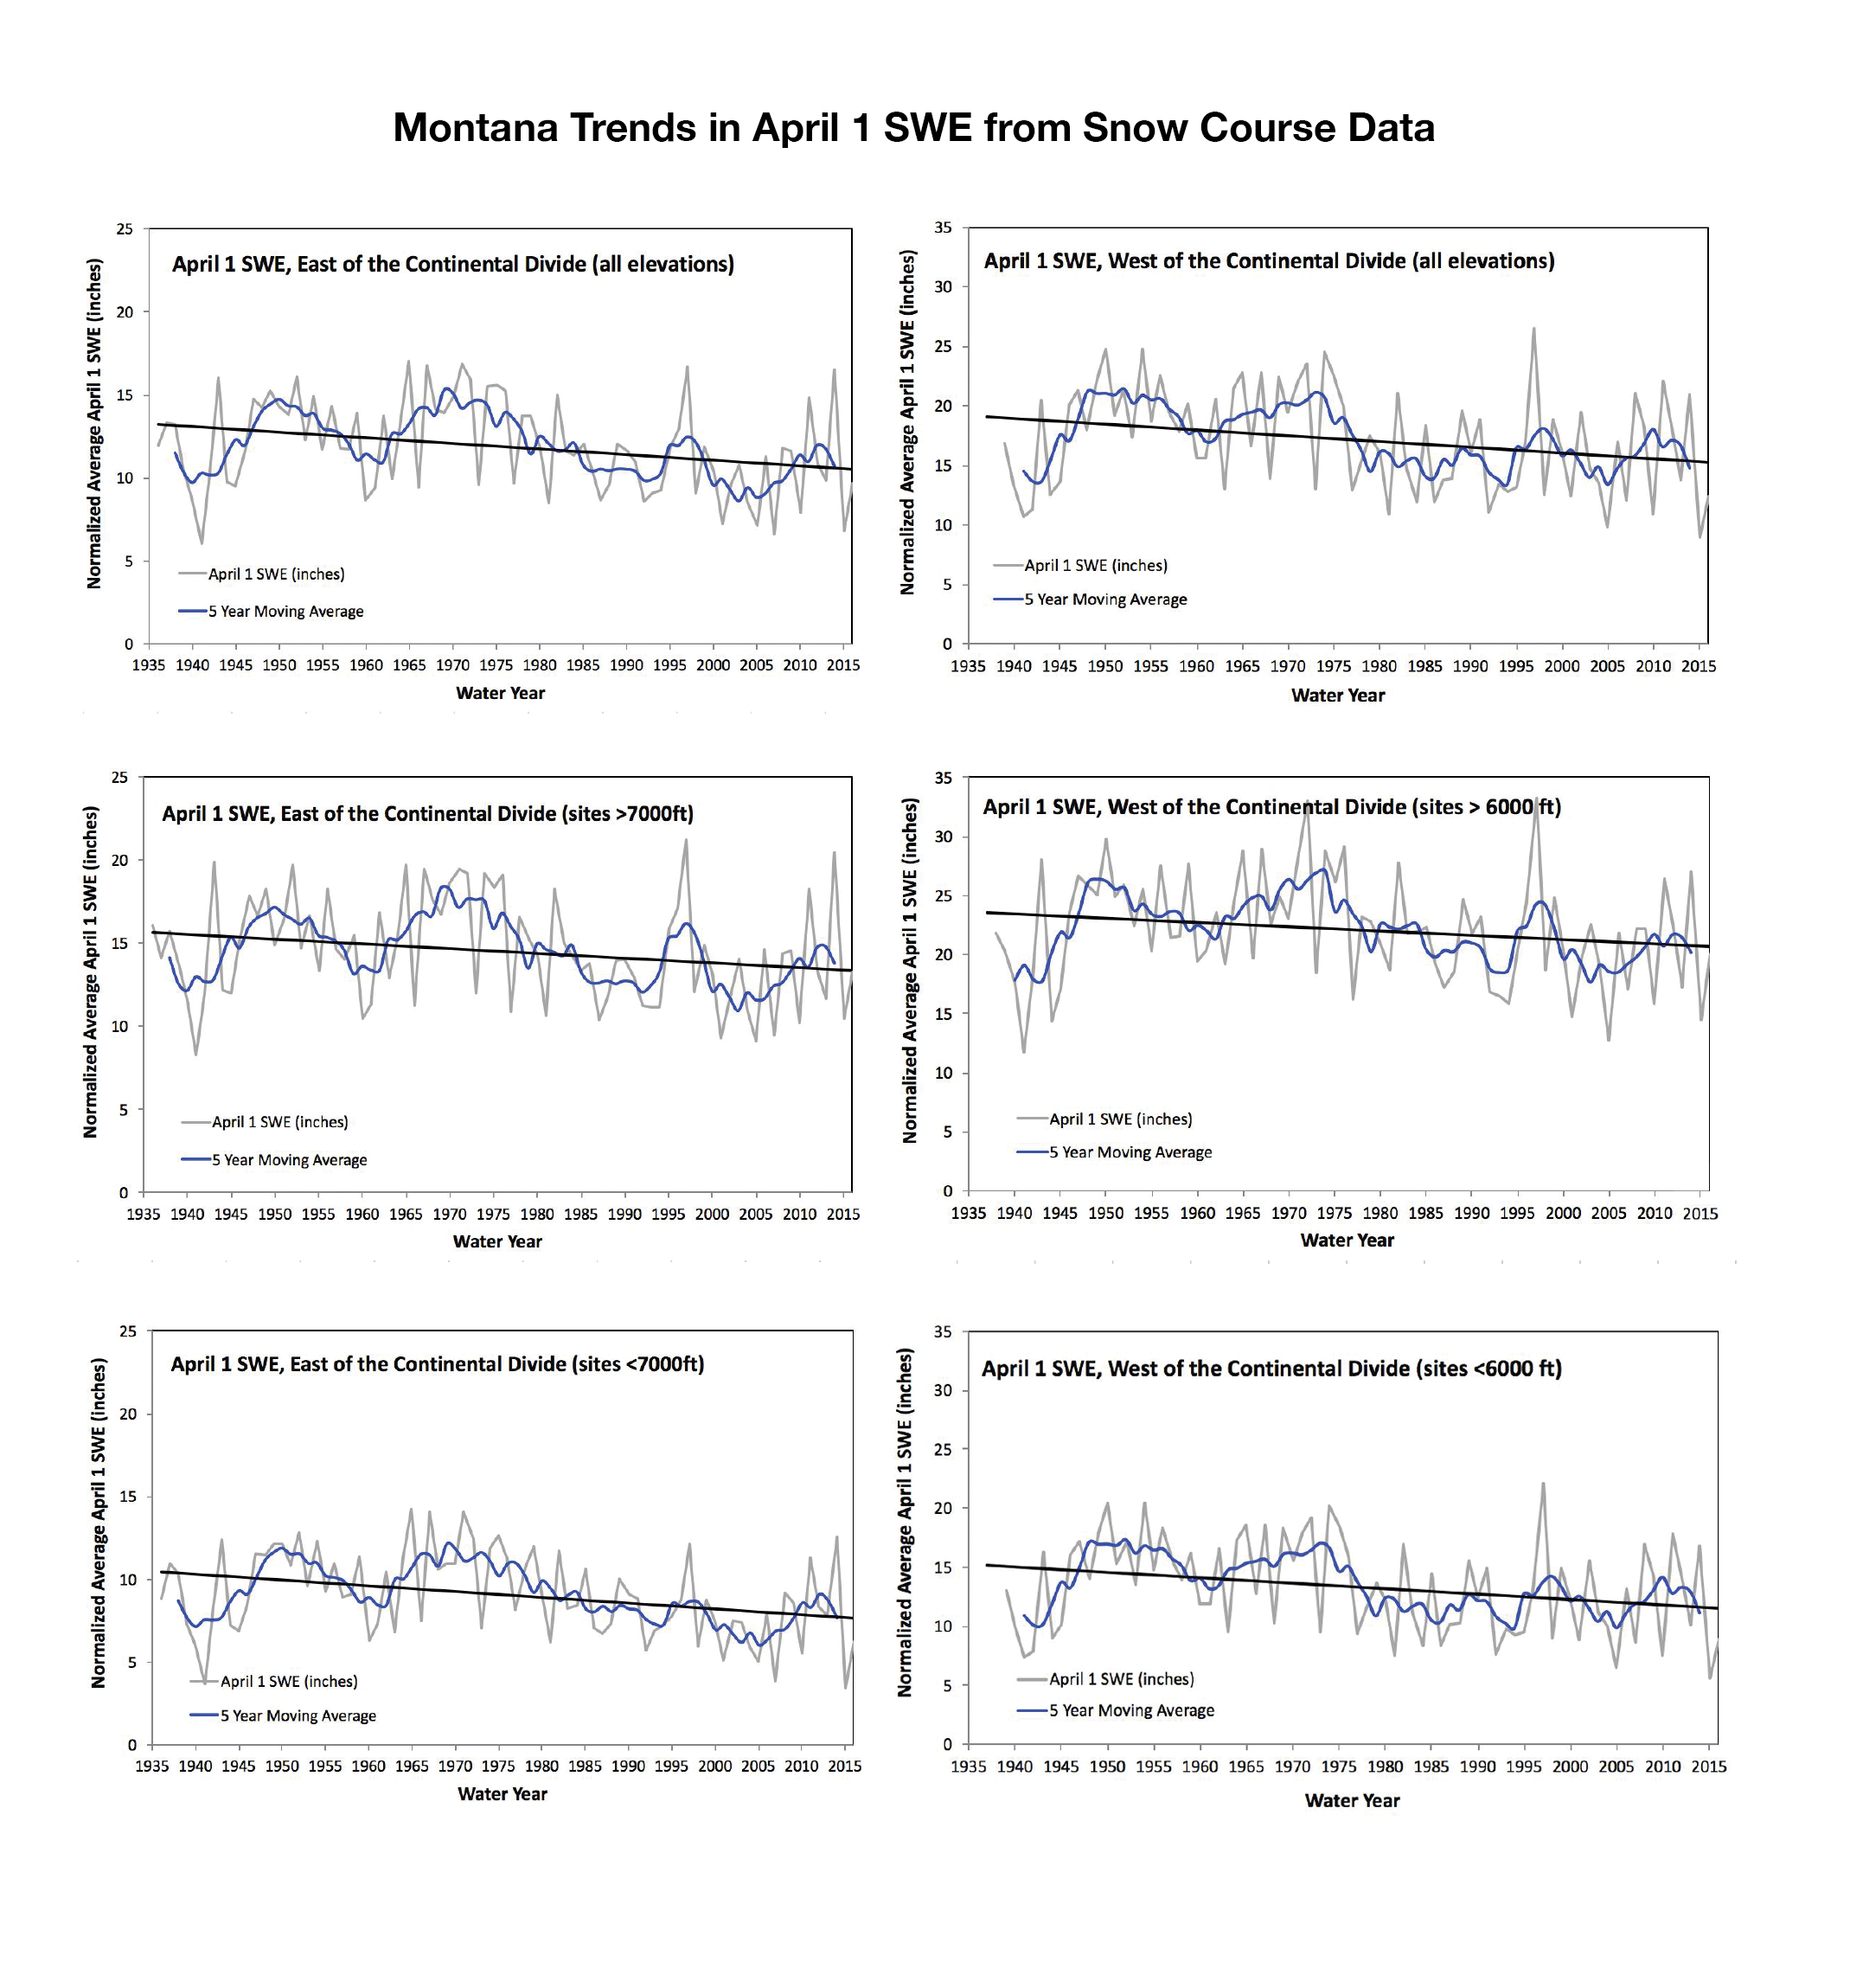
Snow Course groupings on both sides of the Continental Divide show long-term downward trends in April 1 SWE (Figure 3-9, Table 3-2). This observation is consistent with other studies that have described shrinking snowpack volumes in Montana and elsewhere in the western US (Mote et al. 2005; Pederson et al. 2013a; Mote and Sharp 2016). In general, April 1 SWE in Montana has declined roughly 20% over the last 80 yr, and this decline is most pronounced at lower elevation sites (Table 3-2).
| West | East | |||||
| All sites | >6000 ft (>1830 m) | <6000 ft (<1830 m) | All sites | >7000 ft (>2100 m) | <7000 ft (<2100 m) | |
| Decline in inches (cm) of SWE/decade | -0.48 (-1.2) | -0.36 (-0.91) | -0.45 (-1.1) | -0.33 (-0.84) | -0.29 (-0.74) | -0.35 (-0.89) |
| Decline (percent over the record) | -19% | -12% | -23% | -20% | -14% | -27% |
In general, April 1 snow water equivalent in Montana has declined roughly 20% over the last 80 yr, and this decline is most pronounced at lower elevation sites.
Montana’s snowpack is particularly sensitive to warming
Both empirical studies and model projections demonstrate that snowpack in the Northern Rockies and inland Pacific Northwest is more vulnerable to warming than some other regions in the West. For example, Mote and Sharp (2016) showed that western Montana and the Pacific Northwest have experienced the most drastic declines in snowpack volume in the West over the past 80 yr.
Unlike Rocky Mountain regions to the south, Montana stores a significant amount of snowpack at mid and low elevations (below 8000 ft [2400 m]), particularly within the Flathead, Kootenai, and lower Clark Fork basins of northwestern Montana. In regions such as these, the projected increase in temperatures will result in reduced winter snowpack and a higher-elevation snowline (Regonda et al. 2005; Klos et al. 2014).
Low elevations west of the Continental Divide are exposed to relatively warm Pacific air masses. These regions have experienced an increase in precipitation falling as rain instead of snow since the 1950s (Knowles et al. 2006), a trend that is expected to continue under future climate conditions (Barnett et al. 2005).
Snowpack projections for Montana
Here we present projections of April 1 SWE values for three of our focal snowmelt-dominated basins in Montana (Figure 3-10). Projections consist of two future scenarios of greenhouse gas emissions (Representative Concentration Pathways [RCPs], RCP4.5 and RCP8.5; see Climate chapter), for two periods in the future: 2040-2069 and 2070-2099. Model results were compared to a historical baseline period of 1970-2000. These projections highlight the general direction of projected changes and differences among watersheds across the state. Values near the dotted 0% line would represent model results that project no future change in snowpack relative to 1970-2000 data. While our results demonstrate relatively strong agreement among most of the climate models, they should only be used to project the direction of change and not specific future snowpack volumes.
|
|
|
Figure 3-10. APRIL 1 SWE projections for three snowmelt-dominated basins in Montana under two scenarios (RCP4.5 and RCP8.5) and two time periods (2040-2069 and 2070-2099). Data are presented as the projected percent change in April 1 SWE between the baseline period 1970-2000 and two future time periods (2040-2069: upper panel; 2070-2099: lower panel). Box and whiskers plots show variation in projections among the different models. These types of plots appear in other graphs below that depict model projections. The line in the middle of the boxplot represents the median value of all model projections. The bottom and top of the box represent the 25th and 75th percentiles (or first and third quartiles), respectively, of model projections. The upper whisker (line extending from the box) extends from the box to the largest model value no further than 1.5*IQR from the box (where IQR is the inter-quartile range, or distance between the first and third quartiles). The lower whisker extends from the box to the smallest model projection that is no further than 1.5*IQR of the hinge. Few model projections fall beyond the end of the whiskers (i.e., outliers), and these are not shown in the figures. For explanation of specific confidence levels, refer to Future Projections in Water Chapter. |
Our projections show that
- snowpack volumes for the Montana basins studied will very likely decline in the future; and
- the largest projected changes in snowpack appear to be located west of the Continental Divide, and are the same areas that have experienced the largest declines in April 1 SWE over the past 80 years (see, for example, the Clark Fork River in Figure 3-9).
Small headwater basins west of the Continental Divide show this vulnerability because they occupy relatively low elevations that are likely to experience additional days with temperatures above the freezing point. In contrast, many small headwater basins east of the Continental Divide are at higher elevations (often 8000-10,000 ft [2400-3000 m]) and are thus less likely to experience temperatures above freezing during the winter-spring transition (see Climate chapter).
SNOWMELT AND RUNOFF TIMING
Key Messages
Historical observations show a shift toward earlier snowmelt and an earlier peak in spring runoff in the Mountain West (including Montana). Projections suggest these patterns are very likely to continue into the future as temperatures increase. [high agreement, robust evidence]
Earlier snowmelt and spring runoff will reduce late-summer water availability in snowmelt-dominated watersheds. [high agreement, robust evidence]
Changes in Montana’s snowpack, as described in the previous section, have direct consequences for how water is delivered to streams and rivers, both in terms of amount and timing of runoff. Snowmelt runoff refers to snow and ice melting into liquid water, which eventually moves downhill and accumulates to produce streamflow. Snowmelt is a dominant component of the annual water cycle (Figure 3-1) in most mountain regions of the West, including Montana.
The majority of total annual streamflow volume in Montana rivers is delivered during a relatively short period in the spring, typically April through June. In the context of a changing climate, it is critical that we a) examine regional evidence for changes in snowmelt and runoff timing, b) assess what factors are most important in driving these changes, and c) evaluate observed and projected patterns in runoff timing for our focal rivers in Montana.
Observed regional trends in snowmelt and runoff timing
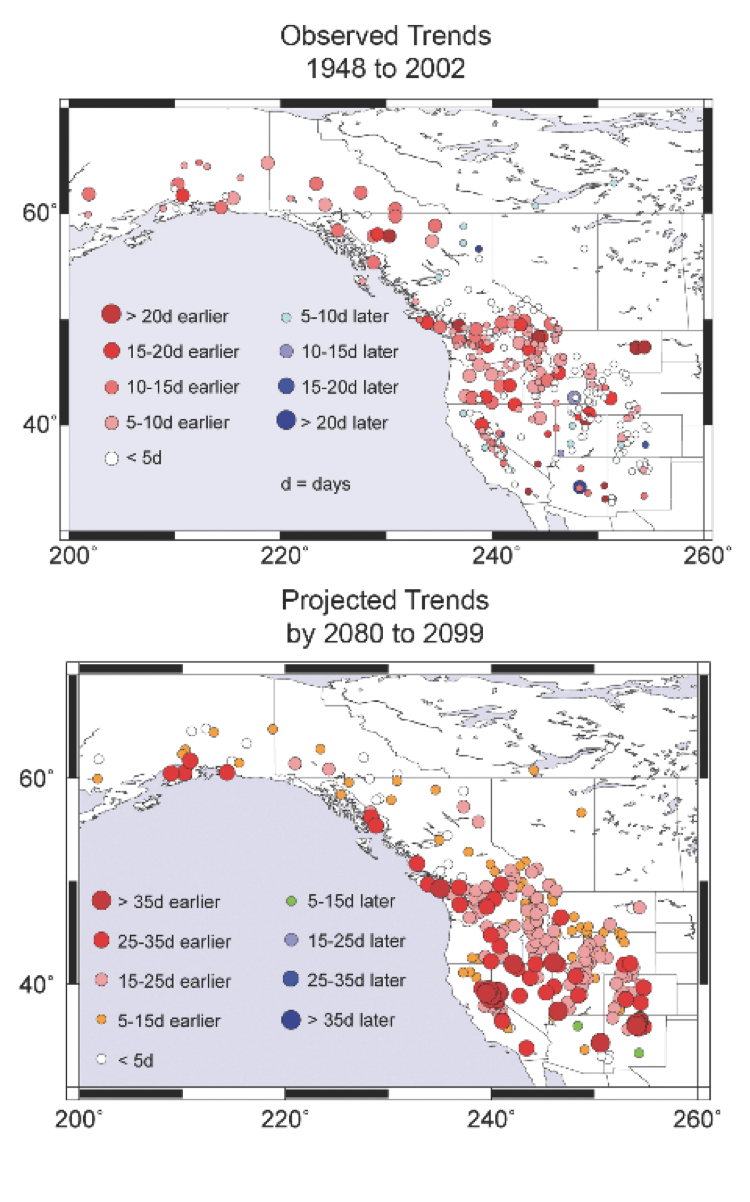
Researchers have already documented shifts toward earlier snowmelt and spring runoff in many mountain regions of the West (Figure 3-11) (Regonda et al. 2005; Stewart et al. 2005). Spring runoff has shifted at least a week earlier in the Northern Rockies over the past half-century, with most of this change occurring since the mid 1980s (Pederson et al. 2011a). Numerous studies in western North America support this conclusion (Dettinger and Cayan 1995; Stewart et al. 2004; McCabe and Clark 2005; Lundquist et al. 2009; Gillian et al. 2010), and some demonstrate that shifts in runoff timing have led to reduced streamflow during the summer months (e.g., Rood et al. 2008).
|
|
|
Figure 3-11. Observed and projected trends demonstrating a general shift toward earlier snowmelt and spring runoff in many regions of the west. Data represent observed and projected shifts in the center of timing17 of streamflow. Projected trends in center of timing for 2080-2099 are compared to a baseline of 1951-1980 (Stewart et al. 2004). |
Factors that influence snowmelt and the timing of runoff
Factors that influence snowmelt and the timing of runoff include temperature, precipitation, and elevation, as described below.
- Temperature.—There is evidence for a connection between warmer winter and spring temperatures and earlier timing of spring runoff for many rivers in western North America (Stewart et al. 2004). While some of this variation has been attributed to decadal-scale climate oscillations (e.g., Pacific Decadal Oscillation), much of it is linked to the trend of long-term warming in spring observed since 1948 (Das et al. 2009).
Spring warm spells are occurring more frequently and earlier in recent years, and even modest warming in winter or spring can lead to large changes in snowmelt and runoff dynamics, especially at lower elevations (Regonda et al. 2005; Stewart et al. 2005; Klos et al. 2014).
Rising winter and spring temperatures have already been observed in most regions of Montana since 1950 (see Climate chapter). Pederson et al. (2010) reported a rapid decline in the annual number of days below freezing in western Montana since the 1980s. In addition, from 1950-2015, spring maximum temperatures increased more than any other season (0.7°F/decade [0.4°C/decade]) (Pederson et al. 2010). Over the same period, winter minimum temperatures increased by approximately 0.6°F/decade (0.3°C/decade). Projections of statewide warming into the future (see Climate chapter) will advance snowmelt to earlier dates.
- Elevation.—Along with slope, aspect, and other features of the local setting, elevation is a critical variable that determines how watersheds across Montana respond to changes in climate because of the relationship between elevation and temperature (Pomeroy et al. 2004; Stewart et al. 2004; Bales et al. 2006; DeBeer and Pomeroy 2009; Lundquist et al. 2009; Pederson et al. 2010). Mid-elevation locations tend to be most sensitive to warming trends because small increases in temperature sometimes result in temperatures rising above freezing, which is less likely at higher (and thus colder) elevations. Regonda et al. (2005) showed that from 1950-1999 spring runoff has come 10-20 days earlier in basins below 8000 ft (2400 m) elevation, while basins above this elevation have shown little to no change in runoff timing. Thus, for Montana, changes in snowmelt timing should be more pronounced for areas west of the Continental Divide and low-elevation sites east of the Continental Divide that contribute to winter snowpack.
- Precipitation.—Observed changes in precipitation across Montana since 1950 are more varied and uncertain when compared to the strong evidence for ongoing and continued increases in temperature. However, there has been a general trend of decreasing winter precipitation from 1950 to present; this pattern is most evident in the northwest and central portions of the state and may be due to increased frequency of El Niño events (see Climate chapter). Natural variation in precipitation influences snowmelt timing and the seasonal distribution of streamflow. For example, below-average winter precipitation can lead to smaller mountain snowpack volumes, which tend to result in shorter duration spring runoff (Hamlet and Lettenmaier 1999; Stewart et al. 2004; Moore et al. 2007; Whitfield 2013). Warming temperatures can also result in more precipitation falling as rain instead of snow, particularly in the Pacific Northwest and western Montana (Knowles et al. 2006), also resulting in reduced snowpack and shorter duration runoff (Knowles et al. 2006; McCabe et al. 2007; Gillian et al. 2010; Knowles 2015). Conversely, particularly high-snowpack years may effectively compensate for warming temperatures by offsetting rapid snowmelt. Spring precipitation as rain or snow can also help to augment years of relatively low winter snow and prevent reduced streamflow. Indeed, increased spring precipitation in recent years has apparently prevented what would otherwise be large snow-related declines in hydrologic yield (Pederson et al. 2011a). In addition, year-to-year fluctuations in spring precipitation may be contributing to variation in the timing of runoff among years (Pederson et al. 2011a).
Model projections for snowmelt and runoff timing
Strong agreement exists among climate models that average temperatures will continue to increase through the mid century (2040-2069) and end-of-century (2070-2099) across Montana (see Climate chapter). The climate models also project an increase in precipitation during winter, spring, and fall, but the magnitude of this change is small relative to historical variation and there is less agreement among models.
We used the same model output described in the snowpack section to assess projected changes in streamflow for our focal river basins. Hydrologic models include uncertainty related to the GCMs selected for the model, as well as uncertainty related to projected future change in elements of the water cycle, such as evapotranspiration. Additionally, all of these models were run without consideration of human water use, which will need to be incorporated to effectively manage water resources (see Missouri River sidebar). Therefore, these projections should not be considered specific predictors of future streamflow volumes, but instead as a useful tool for understanding the general direction (positive or negative) of change.
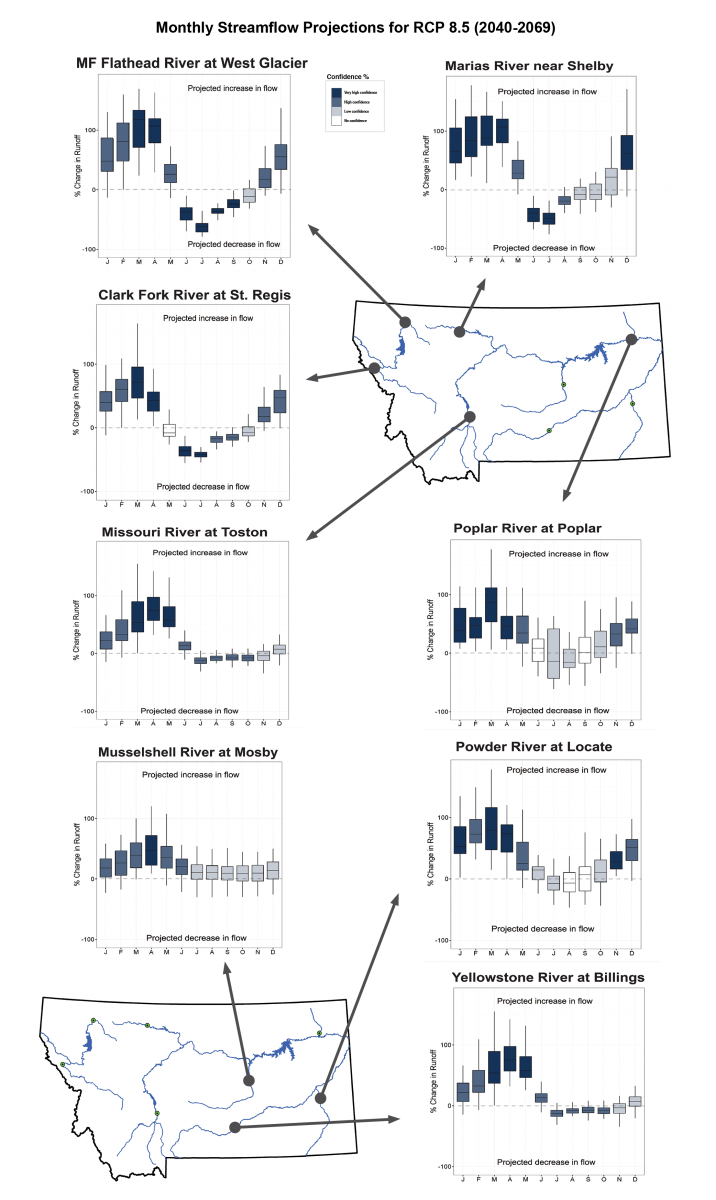
Two distinct patterns of projected streamflow emerge from our analysis, one from watersheds that contain large amounts of land at high elevations and the other from those that do not (Figure 3-12).
In watersheds with headwaters at relatively high elevations—for example, the Yellowstone at Billings, Missouri at Toston, Clark Fork at Saint Regis, and Marias at Shelby—the models show strong agreement that a) January-April runoff is likely to increase, and b) streamflows will likely be reduced during July-September (Figure 3-12). Although the different projections show slight differences in timing among rivers, the overall patterns are consistent: a larger percentage of water will leave these watersheds during winter and early spring, resulting in much less water to support streamflow during summer and early fall. The shift is important given the high demand for water resources in late summer from agriculture, municipalities, and recreation industries.
For watersheds with high-elevation headwaters, the overall patterns in model projection are consistent: a larger percentage of water will leave high elevations during the winter and early spring, leaving much less water to support streamflow later in the year during summer and early fall.
Projections for middle-to-low-elevation watersheds—for example the Musselshell at Mosby, Powder River near Locate, and Poplar River near Poplar—show similar increases in winter and spring streamflow (i.e., most of the projections fall above the 0 line). However, the models agree far less about streamflow patterns during the rest of the year (Figure 3-12), with some projecting increases in streamflow in summer and fall, while others project reduced streamflow during these months.
It is very likely that increased water use in the future will further reduce streamflows during summer months when demand is greatest (see drought section below).
|
|
|
Figure 3-12. Monthly streamflow projections for each of our focal rivers based on RCP8.5 and time period 2040-2069. Data are presented as the projected percent change in runoff between 2040-2069 and the baseline period of 1970-2000. (Boxplots are explained in the caption of Figure 3-10.) For explanation of specific confidence levels, refer to Future Projections in Water Chapter. |
TOTAL ANNUAL STREAMFLOW
Key Messages
Long-term (decadal and multi-decadal) variation in total annual streamflow is largely influenced by quasi-cyclic changes in sea-surface temperatures and resulting climate conditions; the influence of climate warming on these patterns is uncertain. [high agreement, medium evidence]
Total annual streamflows are projected to increase slightly for most Montana rivers, but the magnitude of change and agreement among models vary across the state. [medium agreement, medium evidence]
To this point, our streamflow discussion has focused on how climate influences the timing and distribution of flow throughout the year. However, it is also important to consider patterns of annual streamflow (or annual water supply), which is the total amount of runoff generated by a given watershed throughout an entire year.
Annual streamflow derives from a variety sources including rainfall, snowmelt runoff, groundwater discharge, and glacial runoff. Annual streamflow is critical because it defines the potential volume of water available each year to influence groundwater, fill reservoirs and lakes, and support consumptive and non-consumptive uses of water. Climate-induced changes in annual streamflow have the potential to impact hydroelectric power generation, agricultural production, wildlife habitat, recreation, and other beneficial uses of Montana’s water resources.
Long-term records demonstrate that annual streamflow varies widely over time due to changes in both natural and human-related factors. Here again, we focus largely on atmospheric processes that influence annual streamflow (i.e., temperature and precipitation), which are themselves modified by both natural and human-related factors, such as greenhouse gas emissions.
Interannual variation in precipitation tends to have the greatest influence on year-to-year variation in annual streamflow volumes (Karl and Riebsame 1989; McCabe and Wolock 2011). Years of high snowpack accumulation or high spring and summer rains tend to produce high annual streamflow volumes and hence greater potential water supply. While temperature effects on annual streamflow are much weaker and less consistent than the effects of precipitation, the relative importance of temperature is likely to increase as the climate warms (Tesemma et al. 2015; Woodhouse et al. 2016).
Observed trends in total annual streamflow
On decadal time scales, annual streamflow variation and precipitation are driven by large-scale patterns of climate variability, such as the Pacific Decadal Oscillation (see teleconnections description in Climate chapter) (Pederson et al. 2011a; Seager and Hoerling 2014). Periods of high or low precipitation associated with these patterns generally translate to periods of high or low annual streamflow, respectively (Karl and Riebsame 1989; McCabe and Wolock 2011). Obvious periods of lower-than-average streamflow in most of the focal rivers in Montana include the drought years of the Dust Bowl (late 1920s to early 1940s), the 1950s, the late 1980s to early 1990s, and the early 2000s (Figure 3-13).
Specific years of above- and below-average streamflow differ slightly among river basins due to Montana’s geographic diversity and the varying influence of large atmospheric circulation patterns east and west of the Continental Divide. Interestingly, large semi-cyclic patterns in total annual streamflow are detectable in most Montana rivers, suggesting that parallel changes in water use over time have not been large enough to mask these climate-driven trends. Such patterns in annual streamflow, however, are often hidden for rivers that are highly regulated by dams or large irrigation withdrawals (e.g., the Marias River below Tiber Reservoir) (MT DNRC 2014c).
A key question is whether annual streamflows have changed over time in Montana and, if so, why. Pederson et al. (2011b) reported no recent change in annual streamflow for a number of rivers in the northern Rocky Mountains, including in Montana, despite significant reductions in snowpack. The authors attributed this finding to recent increases in spring precipitation that may have offset reduced snowpack.
Luce and Holden (2009) reported declines in annual streamflow during the driest years (i.e., lowest 25th flow percentile) for a set of Pacific Northwest rivers, including some rivers in Montana west of the Continental Divide. Other work has suggested that streamflow declines in the Pacific Northwest have resulted from reduced mountain precipitation rather than warming (Luce et al. 2013).
|
|
|
Figure 3-13. Long-term patterns of total annual streamflow in our focal rivers. Each panel shows the annual discharge (gray line) expressed as cubic feet per second or CFS (metric unit is m3/s). The blue and red lines show the percentage deviation above (blue) or below (red) the long-term average for each year. The dark black line represents the 5-year moving average. The red shading represents the most significant periods of hydrologic drought for each focal river. |
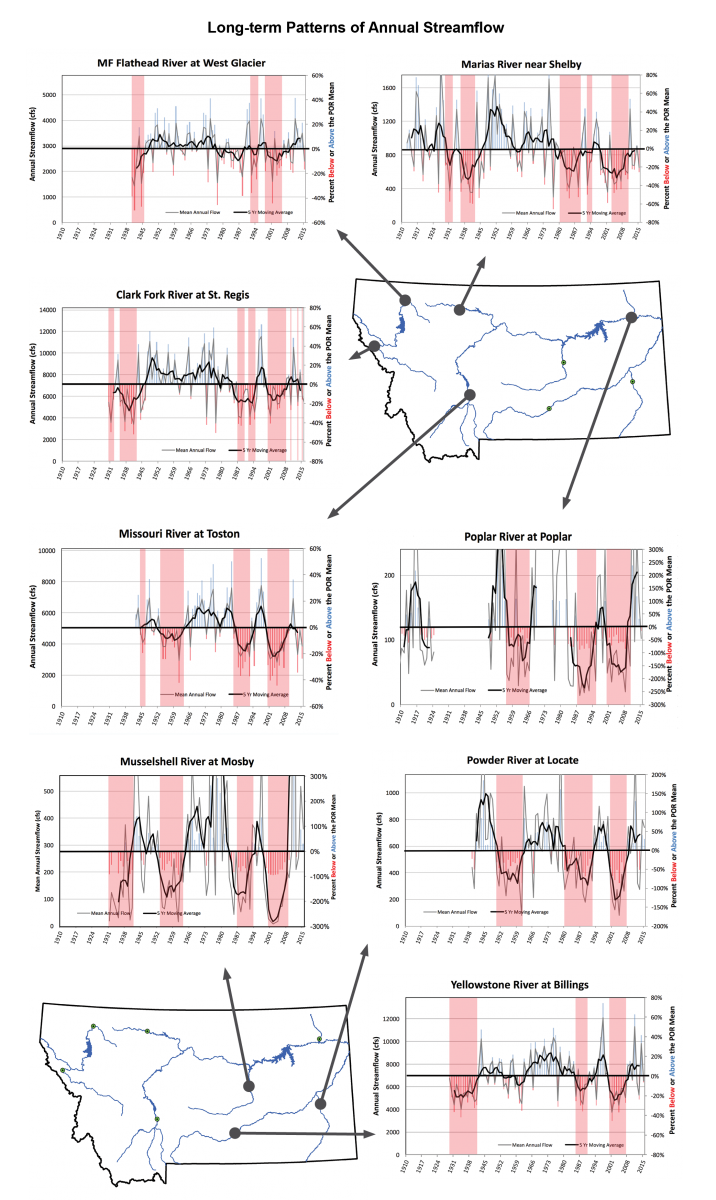
Norton et al. (2014) also reported recent (1960-2010) declines in annual streamflow for 30 rivers in the Upper Missouri watershed. It is unclear whether these declines are attributed to changes in climate or other factors such as changing patterns of land or water use (e.g., conversion of agricultural lands to subdivisions, or changing irrigation methods and practices).
Factors that influence total annual streamflow
At local scales and over shorter periods, annual streamflow responds to seasonal changes in climate variables (e.g., temperature, precipitation) and related processes such as evapotranspiration. The relative influence of these factors on annual streamflow differ across the state’s watersheds. Thus, identifying the most important factors that influence annual streamflow in each basin can help us understand how changing climate may influence future water supplies.
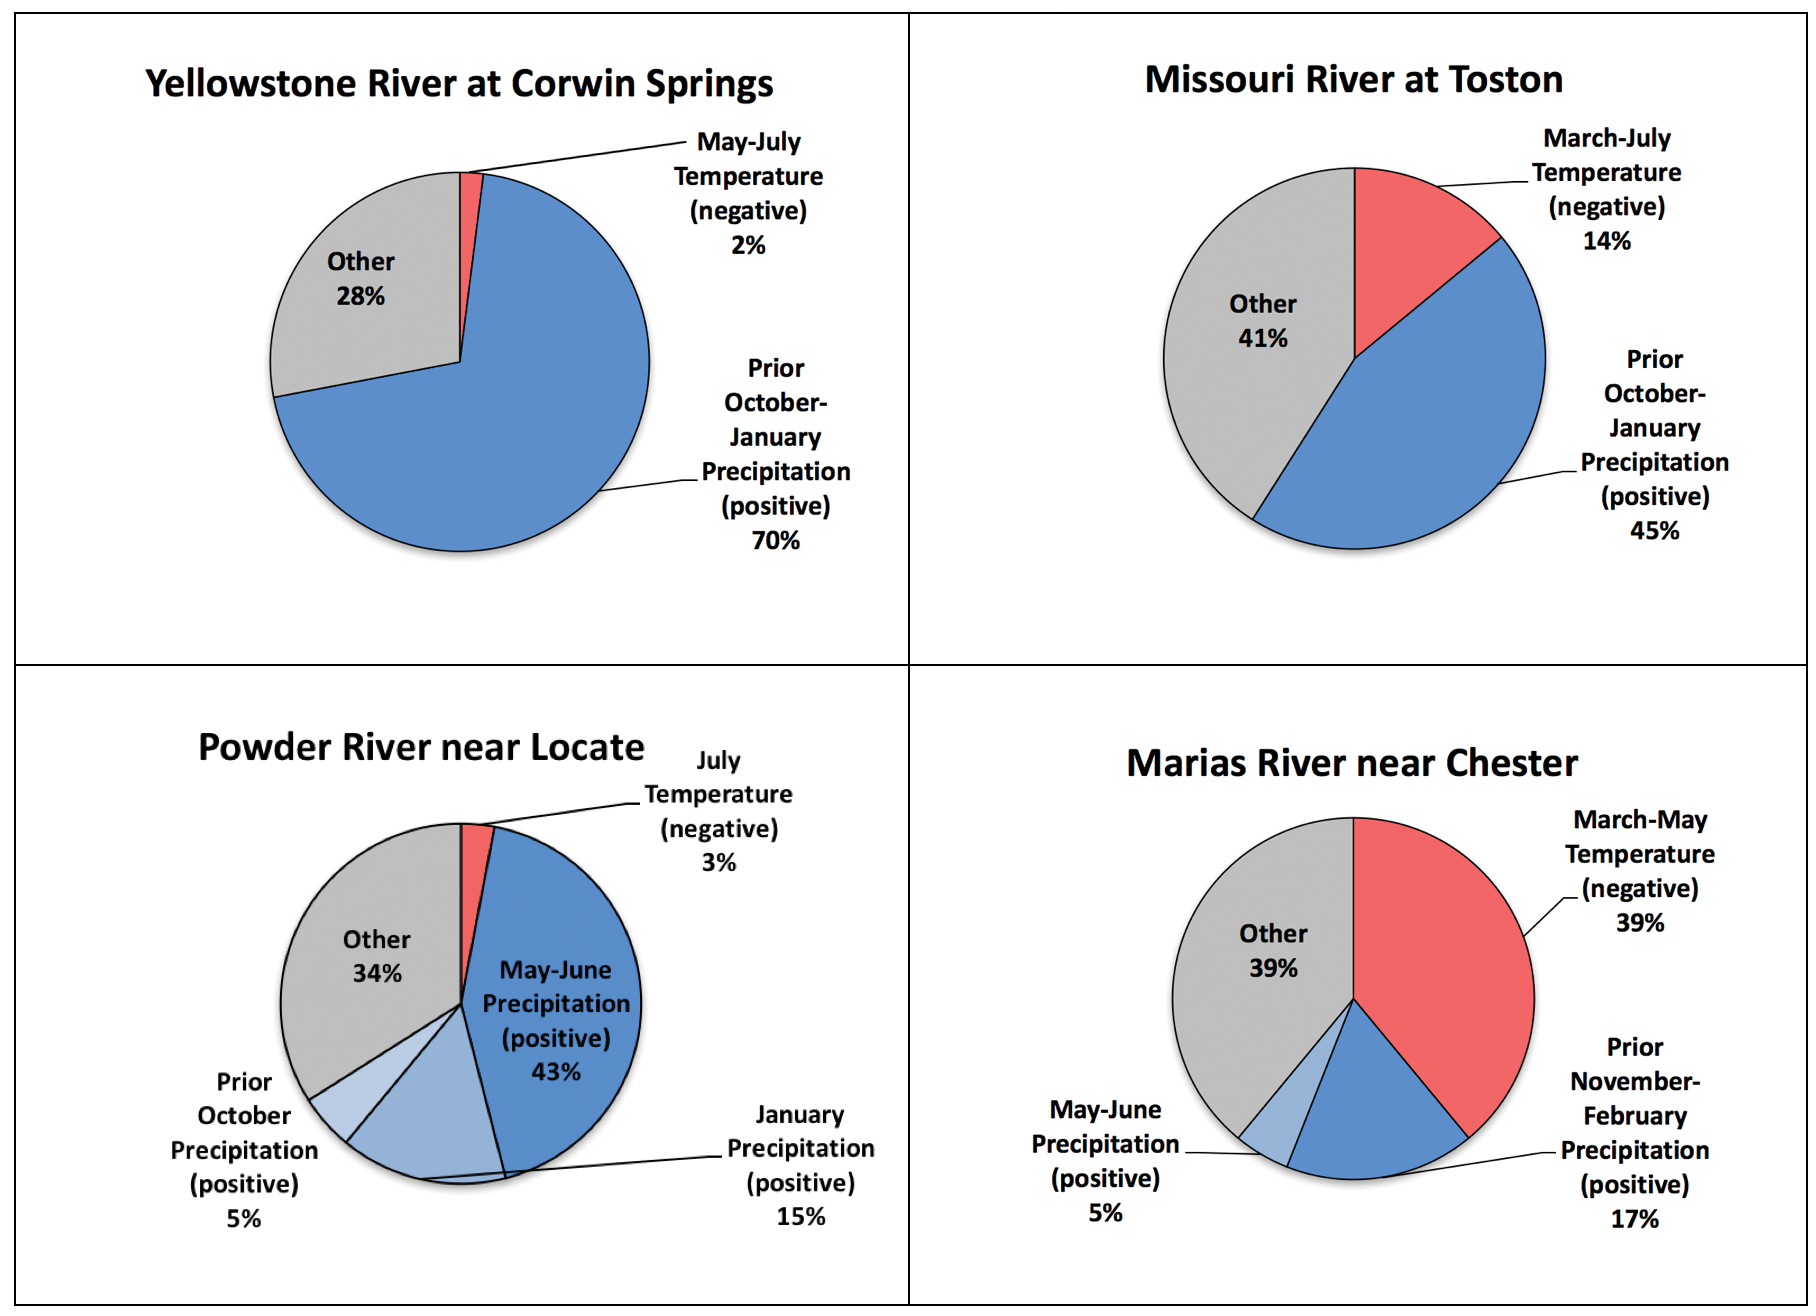
Analysis for the Upper Missouri River Headwaters Study quantified climate factors impacting annual streamflow variability for a number of important watersheds in Montana (USGS undated; analysis contributed by Connie Woodhouse, University of Arizona). The work, which covered 1936-2010, considered average monthly temperatures and total monthly precipitation for the water year (prior October to September) as possible predictors of annual streamflow. Importantly, this particular analysis was conducted with streamflow data corrected for water use and human modification (i.e., naturalized flows). Thus, these results provide a window into the direct climate factors that impact streamflow. A summary of results explaining interannual variability of streamflow follows.
- For the Missouri River at Toston, fall-to-early-winter (October-January) precipitation accounts for nearly half (45%) of the variability in total annual streamflow (Figure 3-14).18 Years of high winter precipitation lead to years of high annual streamflow. Snowmelt season (March-July) temperatures explain an additional 14% of the interannual variation in flow, likely because warmer temperatures during this time can lead to greater evapotranspiration and reduced annual streamflows.
- In contrast, for the Marias River basin near Chester,19 spring-to-early-summer temperatures, not fall-to-winter precipitation, account for the largest amount (40%) of annual streamflow variation (Figure 3-14), although reasons for this observation are not entirely clear. Prior November-January precipitation is the second most important factor (17% of the variation), with spring-early summer (May-June) precipitation being third (5%).
- For the Powder River near Locate, May-June precipitation accounts for close to half (43%) of the annual variability in streamflow, probably because southeastern Montana receives the majority of its annual precipitation in the spring and early summer. January precipitation accounts for 15% of annual variation, showing that winter precipitation from the Powder River’s alpine headwaters in Wyoming is also important.
- For the Yellowstone River at Corwin Springs,20 at the northern edge of Yellowstone National Park, fall and early winter precipitation (Oct-Jan) account for 70% of the annual variability. Runoff season temperatures have a minimal effect on annual flow, perhaps because much of the watershed consists of high-elevation terrain and snowpack that is less affected by variation in spring temperatures.
The Missouri River analysis suggests that large snow years that are associated with cold air temperatures during runoff lead to the greatest annual water supplies. The Marias River analysis suggests that rising spring temperatures could exacerbate low flows in the Marias during years of below-average precipitation. All analyses include significant other variation that remains unexplained, suggesting that a) the models do not include all factors influencing annual streamflow, and b) there is some observational and statistical error.
|
|
|
Figure 3-14. Climate factors associated with naturalized streamflow in four Montana river basins. The size of pie pieces correspond to how strong the particular climate factor influences total annual streamflow. Some of these factors lead to greater flow (positive), while others lead to reduced annual flow (negative). See text for further explanation. |
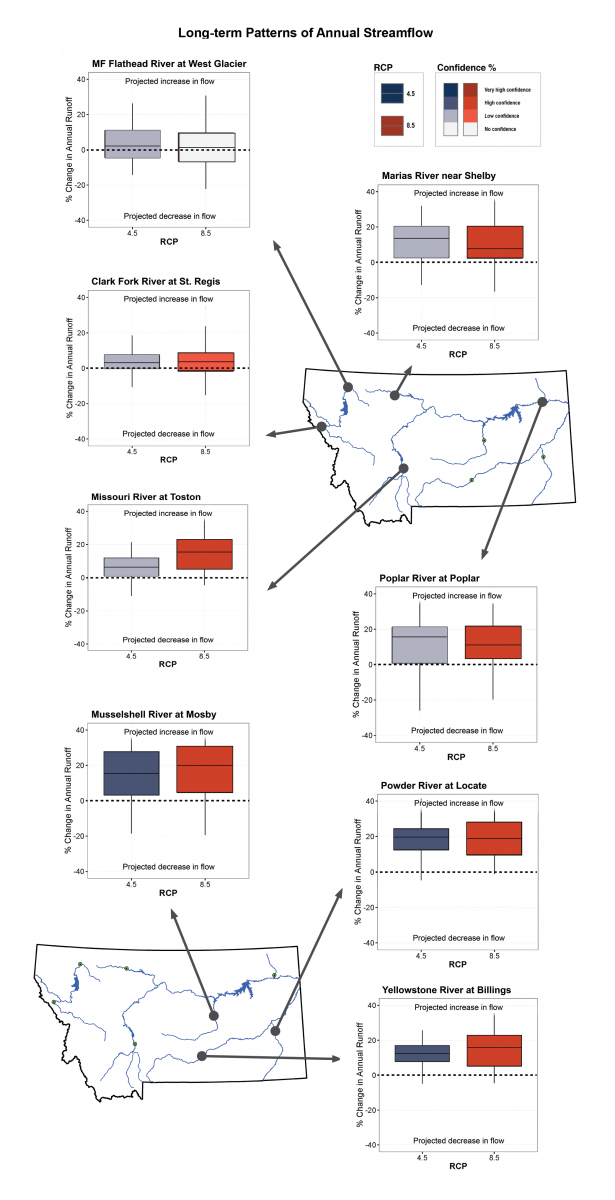
Annual streamflow projections
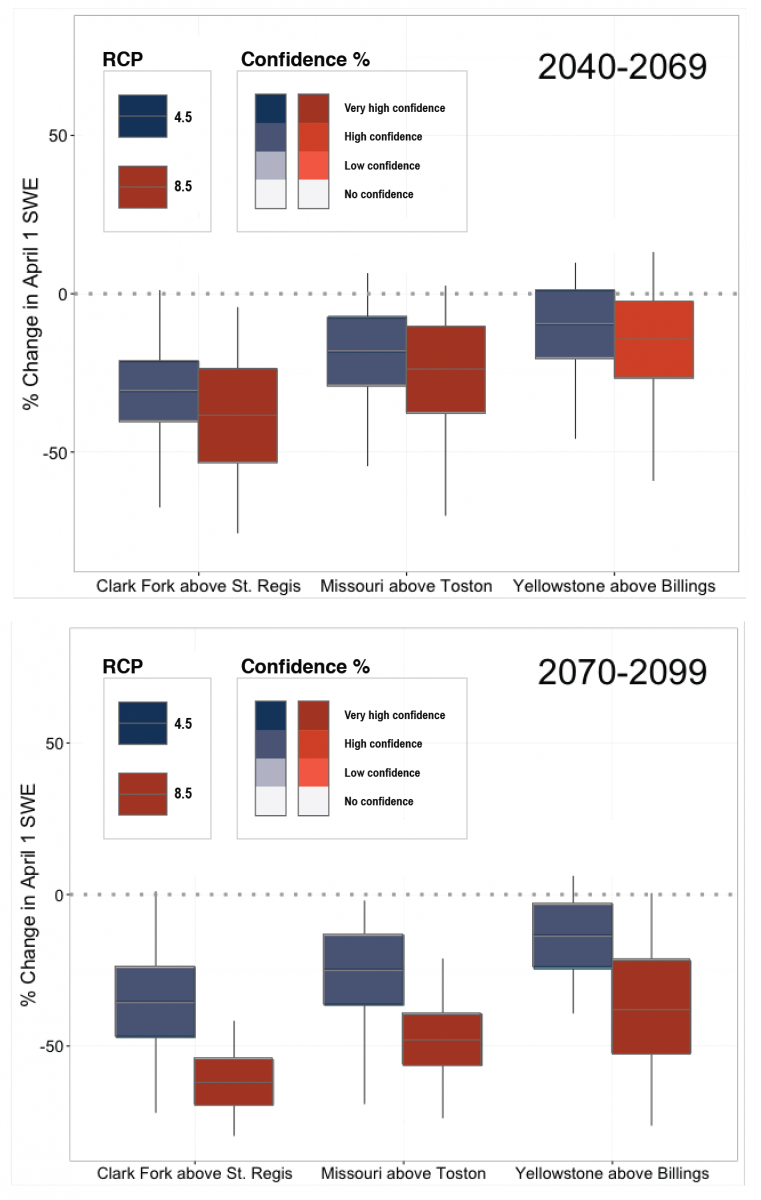
Model projections for annual streamflow (Figure 3-15) show little agreement among models regarding the direction and magnitude of change in our two focal rivers west of the Continental Divide (Middle Fork of the Flathead and Clark Fork at St Regis). In contrast, projections show moderately-high to high agreement that total annual streamflow will increase east of the Continental Divide (e.g., Missouri River, Yellowstone River, Musselshell River), especially under the RCP8.5 emission scenario (see Climate chapter).
|
|
|
Figure 3-15. Total annual streamflow projections for the focal rivers under RCP4.5 and RCP8.5 for 2040-2069. Data are presented as the projected percent change in runoff between 2040-2069 and the baseline period of 1970-2000. (Boxplots are explained in the caption of Figure 3-10.) For explanation of specific confidence levels, refer to Future Projections in Water Chapter. |
GROUNDWATER
Key Messages
Local responses of groundwater resources to climate change will depend on whether aquifers are directly sensitive to climate variability, are buffered from climate by water-use practices such as irrigation, or are used to meet water demands that exceed or replace surface water supplies. [high agreement, robust evidence]
Groundwater demand will likely increase as increasing temperatures and changing seasonal availability of traditional surface water sources (i.e., dry stock water ponds or failure of canal systems to deliver timely water) force water users to seek alternatives. [high agreement, medium evidence]
Groundwater—water that is stored and transmitted in aquifers below the Earth’s surface—is a crucial but hidden part of the water cycle. On a global scale, groundwater represents 96% of available freshwater (excluding polar and glacier ice). Groundwater is one of Montana’s most valuable natural resources: a) it is often the only source of water for domestic use outside of municipalities, either for individual homes or small public water supplies; b) it provides water for livestock production and agriculture in the certain parts of the state; and c) it plays a critical role in sustaining streamflow throughout the year (in a typical Montana stream, groundwater contributes 50% of the annual flow [MT DNRC 2015]).
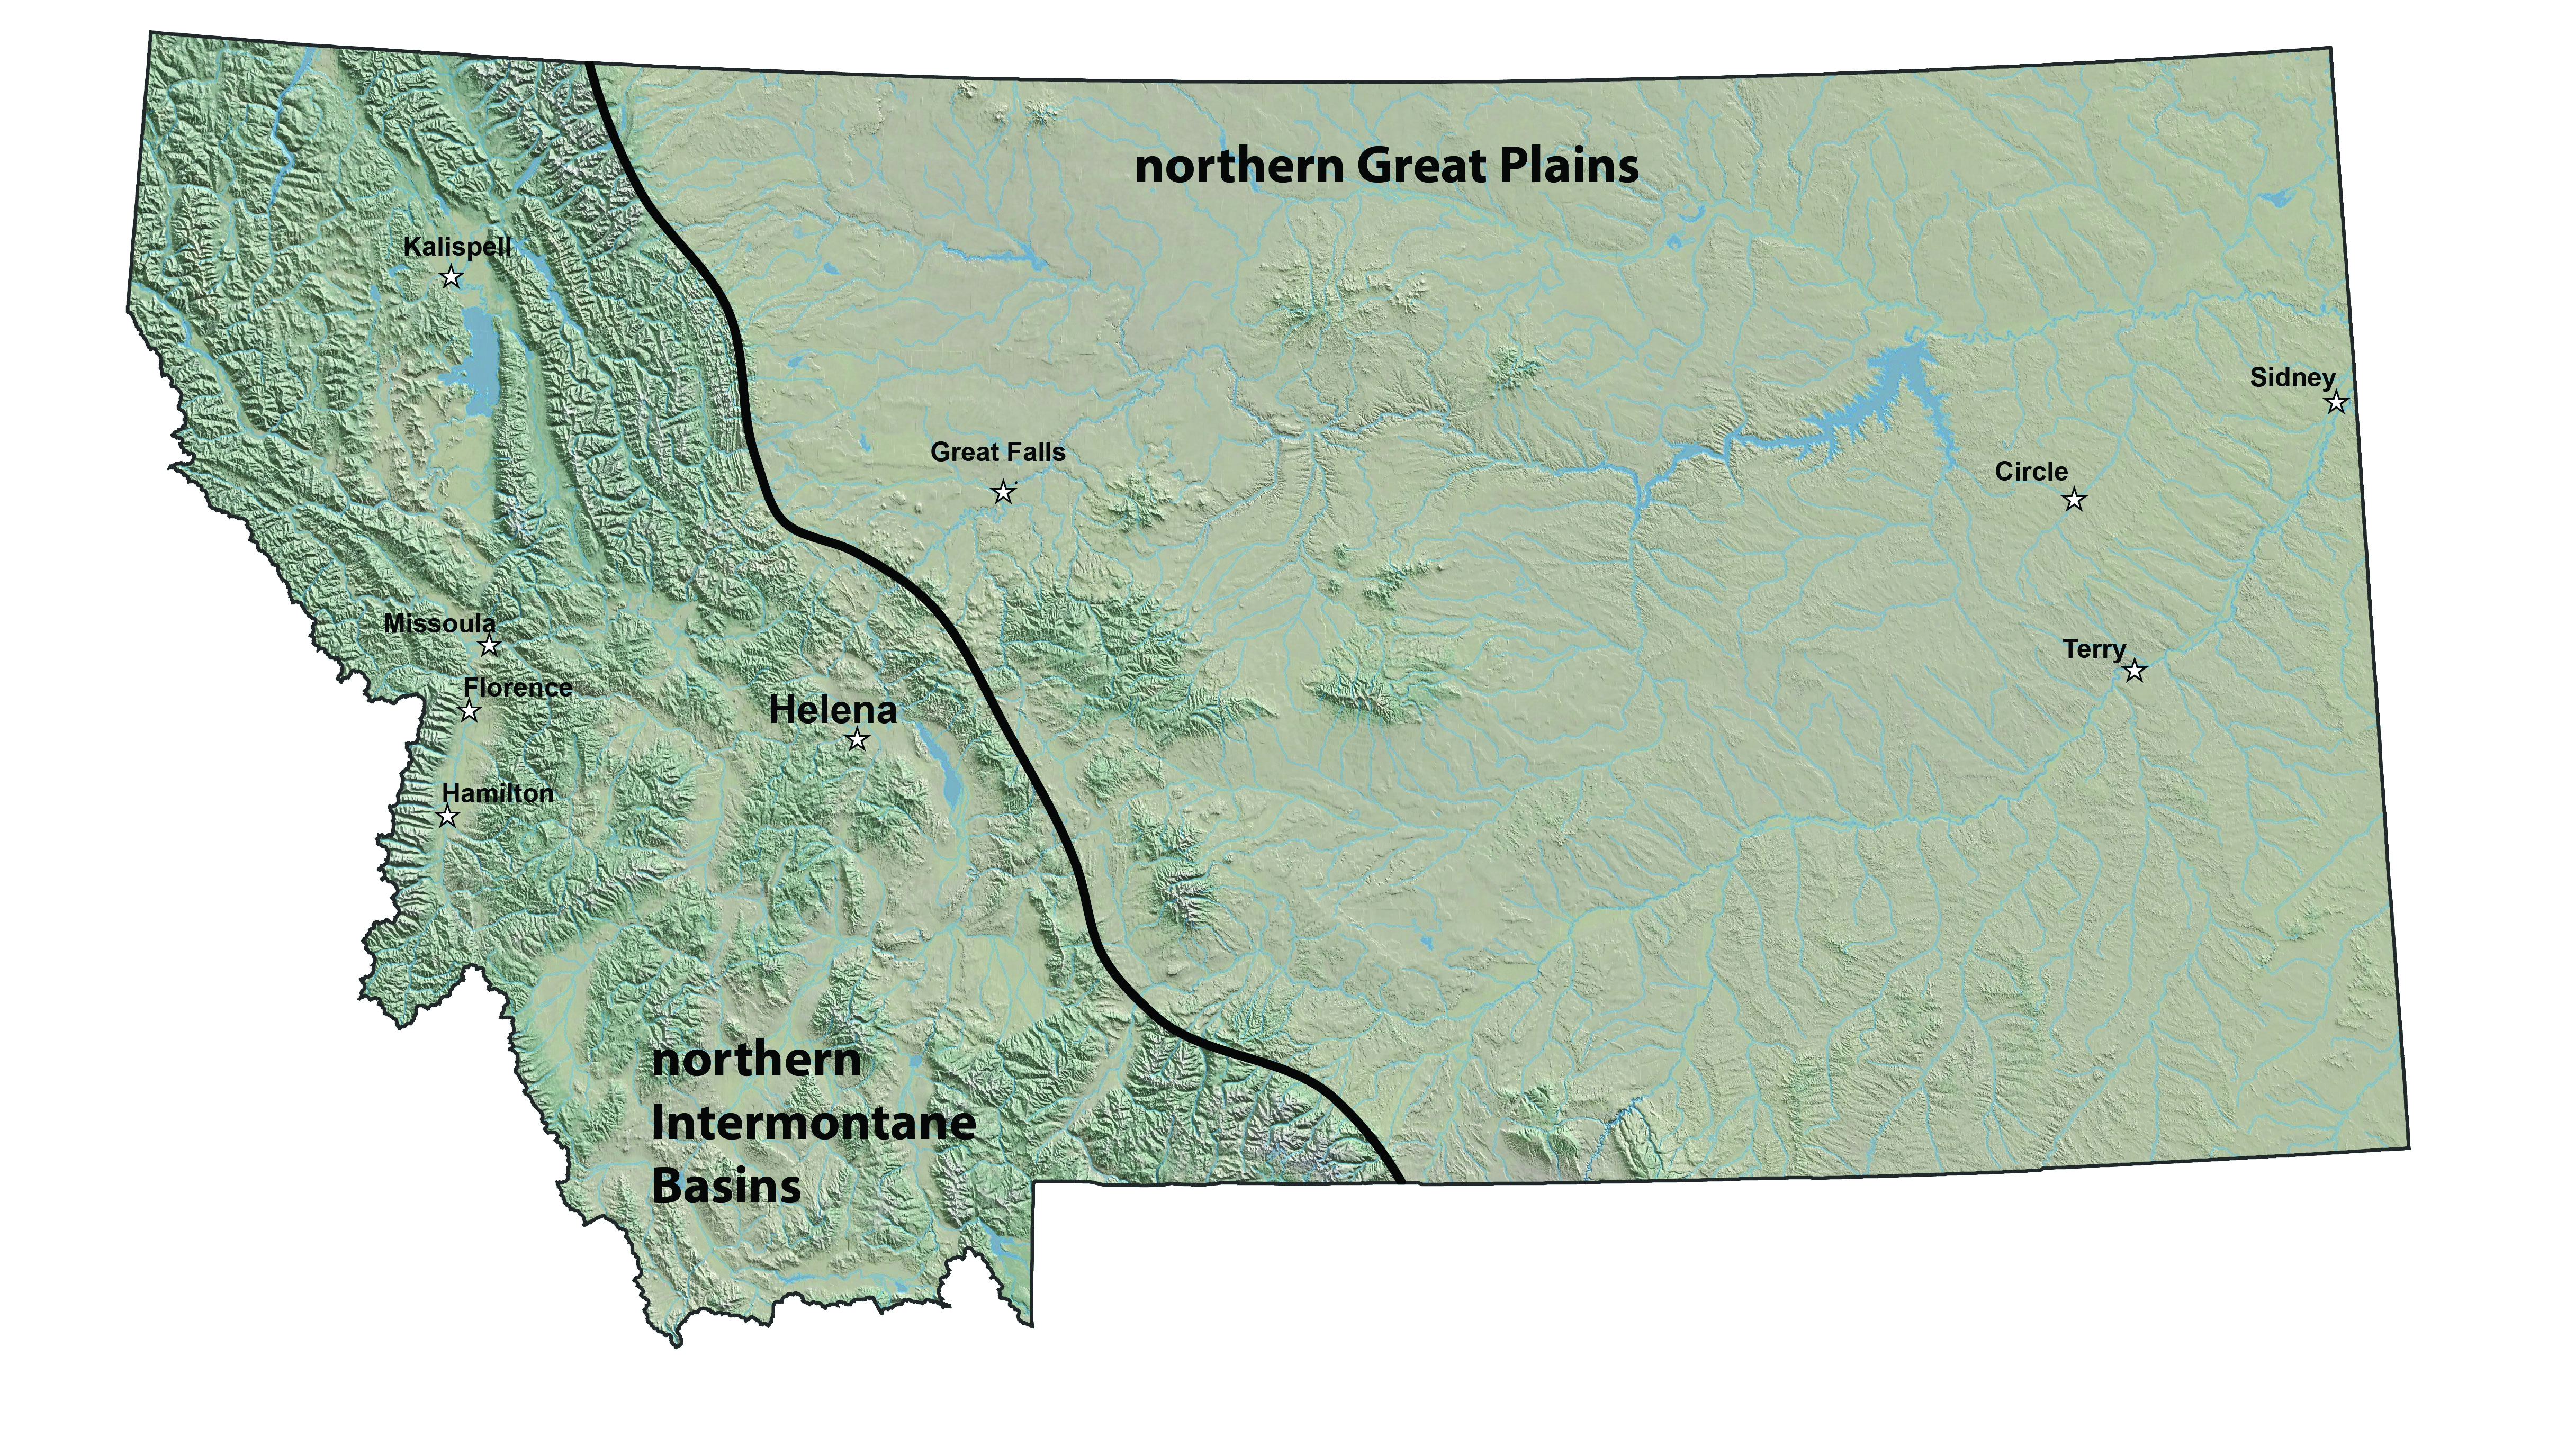
Montana’s aquifers are closely tied to the geology of the state’s two prominent geographic regions (Figure 3-16):
- The intermontane basins of the northern Rocky Mountains.—Within these basins groundwater generally occurs in shallow alluvial (sand and gravel) aquifers, and in deep-confined to semi-confined basin-fill aquifers, both of which contain large amounts of water.
- The northern Great Plains of eastern Montana.—Aquifers in this region are not as productive, but groundwater is nonetheless highly utilized. Layers of sedimentary sandstone and limestone form the most important aquifers. Alluvial aquifers within major river valleys are more localized, but also important.
Each geographic region has a unique climate, geology, and geologic history; these, in turn, have created the different hydrogeologic settings and determine the location and size of groundwater.
|
|
|
Figure 3-16. Montana is divided into two physiographic regions: the intermontane basins of the northern Rocky Mountains, and the northern Great Plains of eastern Montana. |
Water moves between the surface and subsurface (groundwater) in response to hydrostatic forces, as follows:
- Groundwater recharge (water movement from surface to subsurface) results from precipitation and/or through interaction with surface-water bodies (e.g., rivers and lakes). In the snowmelt-dominated intermontane basins of western Montana, groundwater recharge mechanisms include: 1) diffuse movement of precipitation and snowmelt through soil to groundwater, 2) focused gains of water from ephemeral or perennial streams, especially along mountain fronts, and 3) percolation of excess irrigation water below canals and fields. In the large sedimentary aquifers of eastern Montana, groundwater recharge is principally by 1) focused recharge through streambeds, and 2) diffuse infiltration of precipitation in rocky outcrop areas.
- Groundwater discharge (water movement from subsurface to surface) is the loss of water from an aquifer to wells, surface water, or the atmosphere, driven by human and natural processes.
Residence times for groundwater can range dramatically, from days in shallow alluvial aquifers to tens of thousands of years in deep bedrock aquifers. Residence time is one of the factors that can affect an aquifer’s sensitivity to climate change. Groundwater systems with longer residence times may be less impacted by a changing climate than those with short residence times.
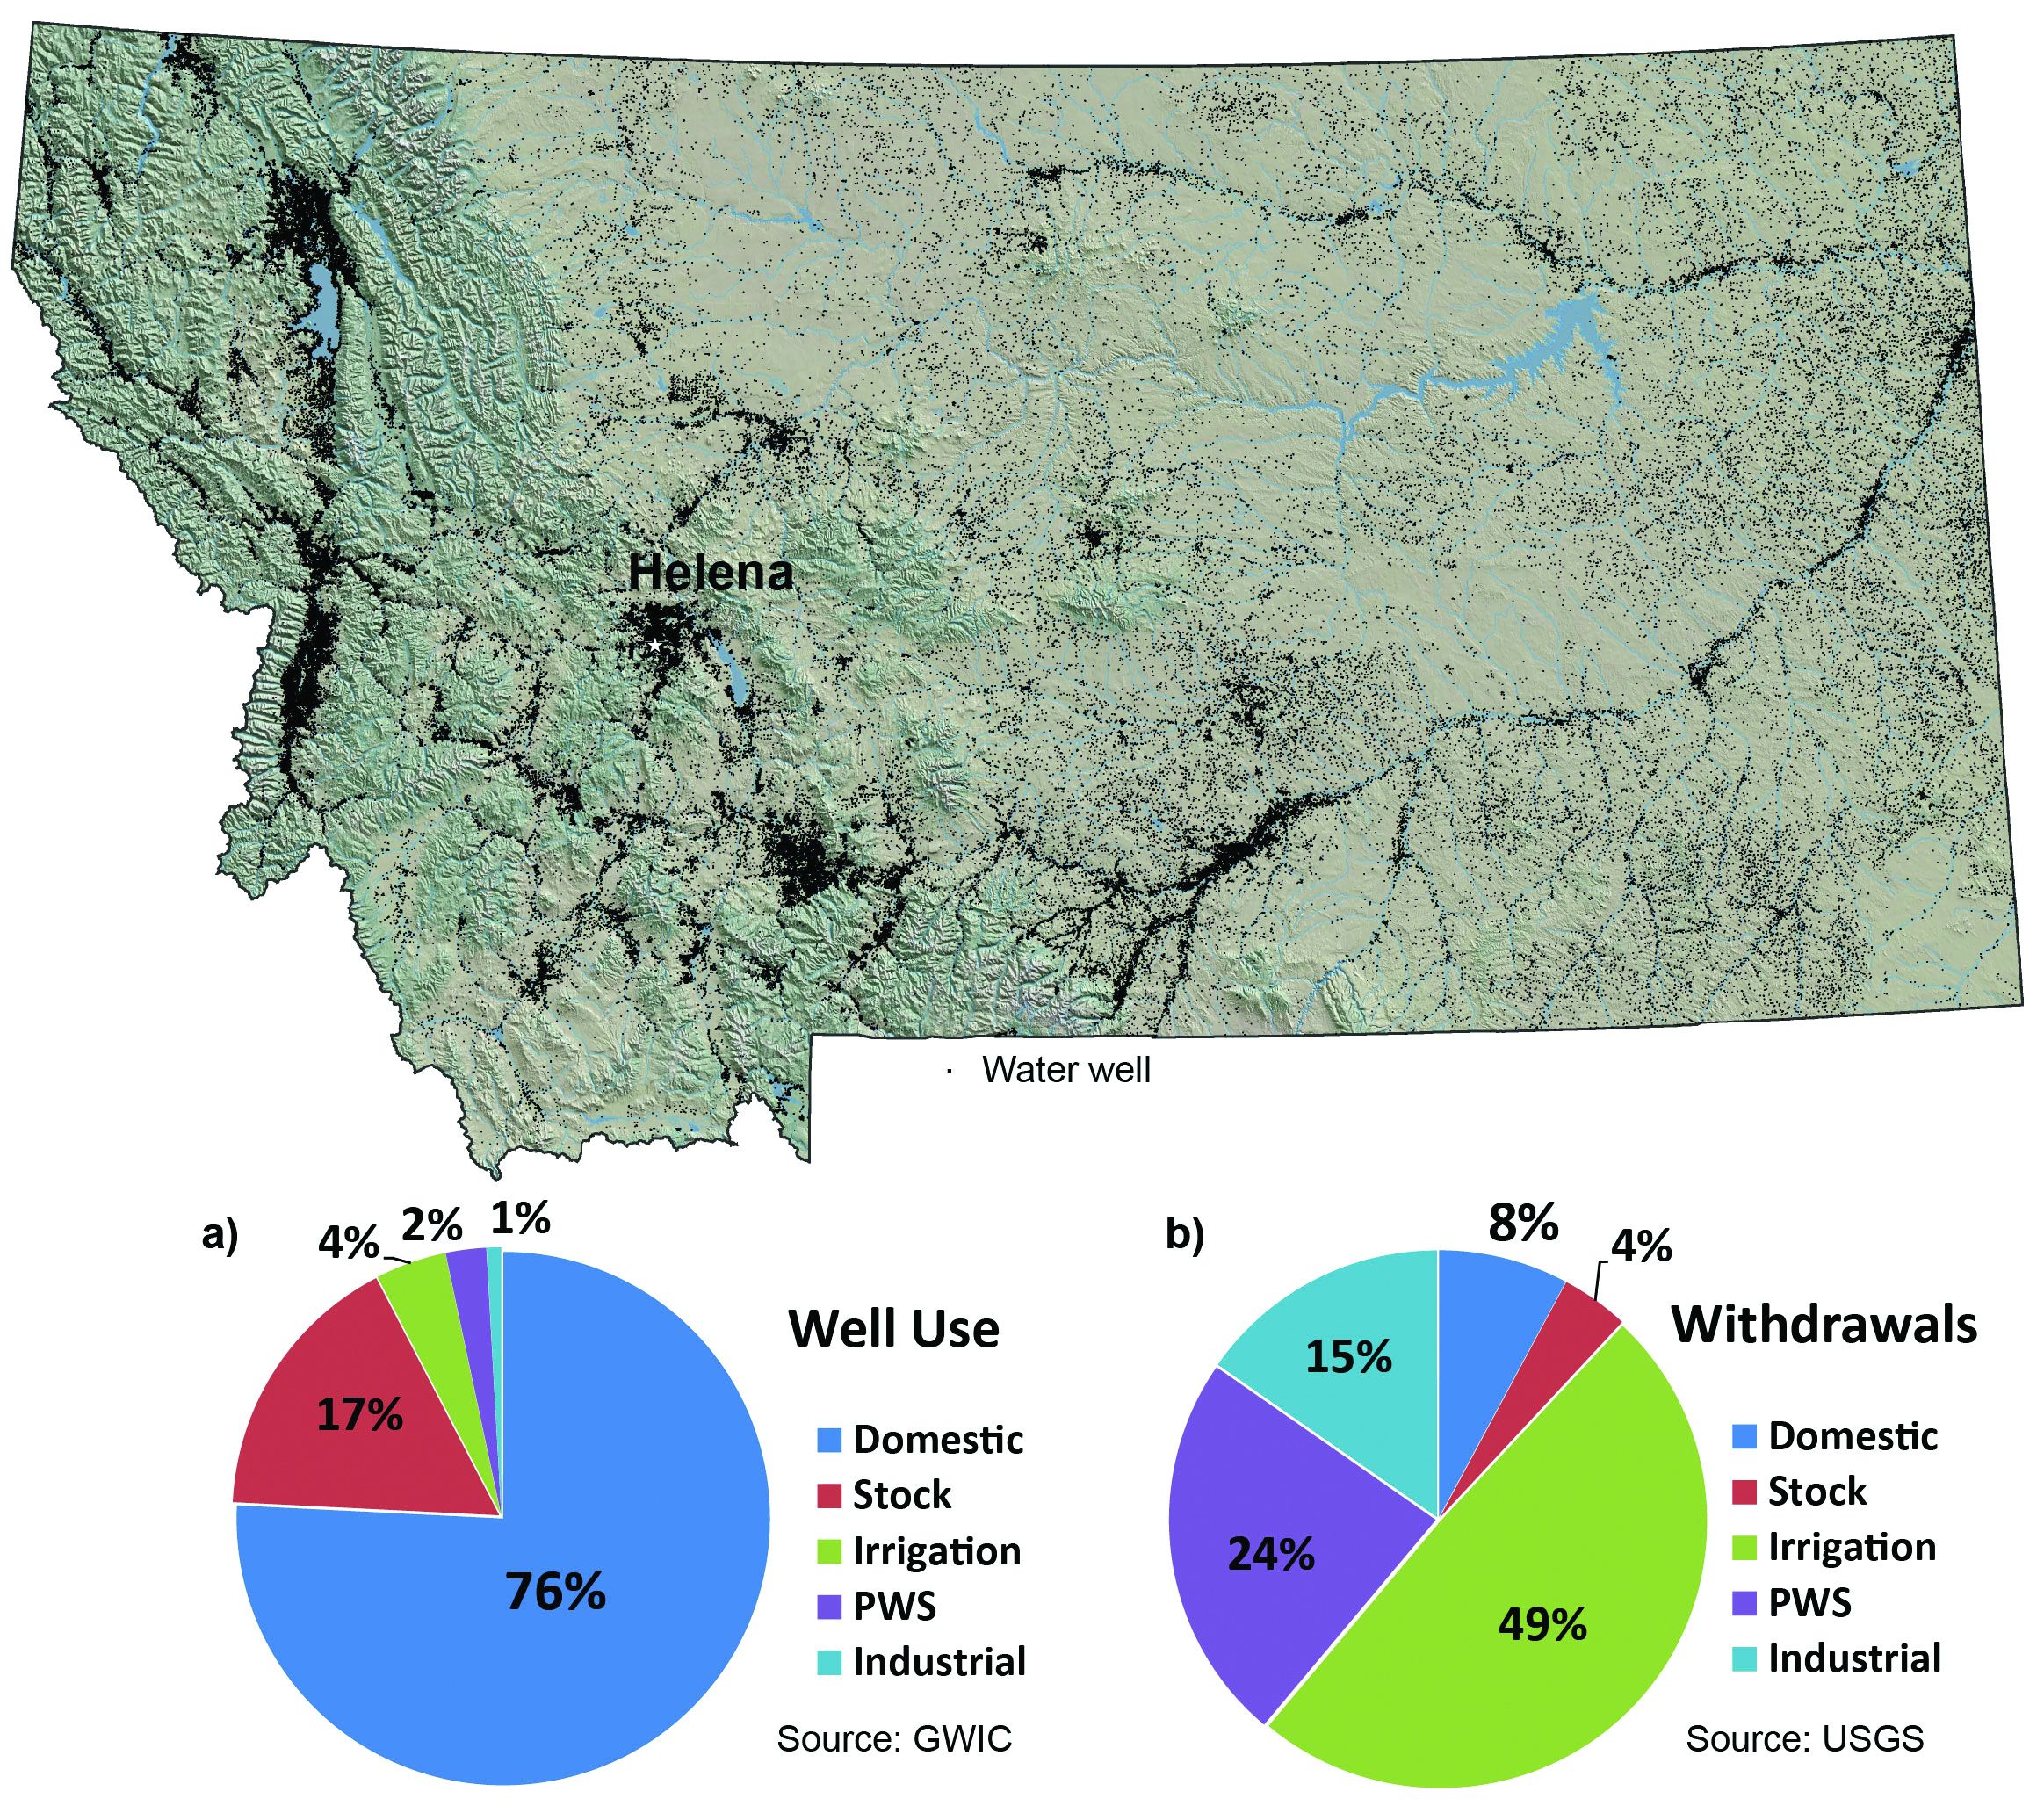
In Montana, more than 200,000 wells withdraw about 875 acre-feet/day (1.1x10⁶ m3/day) for stock, irrigation, industrial, domestic, and public water supply uses (Figure 3-17) (MBMGa undated). In Montana’s rural areas, groundwater supplies stock, ranch, and domestic needs. In some of Montana’s more urban areas—for example, Missoula, Kalispell, and Sidney—groundwater is the public water supply source.
Groundwater also plays a crucial role in sustaining streamflow throughout the year. About half of the total annual flow in typical Montana streams derives from groundwater (MT DNRC 2015).
|
|
|
Figure 3-17. There are roughly 200,000 wells (tiny black dots in figure) that provide water for a variety of uses: a) most wells are for domestic and stock use; b) most withdrawals are for irrigation and public water supply. |
The effects of climate change on groundwater resources are relatively uncertain, but the sensitivity of a given aquifer to change will depend on its geographic setting, and the particular mechanisms of groundwater recharge. Projected climate change is likely to reduce recharge, increase water demand, and alter interactions between groundwater and surface-water systems (Earman and Dettinger 2011; Green et al. 2011; Huntington and Niswonger 2012; Taylor et al. 2013). Reductions in recharge are expected for mountain aquifer systems because of decreased snowpack and changes to patterns of infiltration. The gradual character of snowmelt is more favorable to infiltration than rainfall events; therefore, as an increasing percent of precipitation falls as rain instead of snow, infiltration is likely to decrease, despite projected increases in winter and spring precipitation. Rising temperatures will also lead to a longer growing season, in turn increasing evapotranspiration and further reducing recharge (Meixner et al. 2016) (see Climate chapter). These expected reductions in recharge might appear contrary to projected increases in annual streamflow (Figure 3-15). However, changes in the character of precipitation (e.g., shifts from snow to rain or increases in extreme precipitation events) may cause more water to run off into streams and less to infiltrate into groundwater aquifers. Thus, surface water contributions and annual flow in a particular watershed may increase, even as recharge and baseflow contributions to streamflow decline.
In the sections that follow, we review groundwater information from three representative Montana aquifer systems (MBMGa undated). The data show how these systems have differentially responded to historical climate variability, which in turn provides insight into how groundwater resources might respond to future climate variability.
Madison Limestone—an aquifer sensitive to changes in climate
The Madison Limestone is a bedrock aquifer that underlies most of central and eastern Montana. The formation outcrops in the Little Belt and Big Snowy mountains of central Montana, where precipitation as snow and rain infiltrates into the groundwater system. Away from the mountains, hundreds of feet of non-aquifer, impermeable shale formations separate the Madison Limestone from the surface. However, where limestone layers are within 500-900 ft (150-270 m) of the land surface, the Madison Limestone aquifer is a productive and important source of domestic, municipal, industrial, and stock water. The aquifer is the source for many large springs, including Giant Springs at Great Falls and Big Springs at Lewiston.
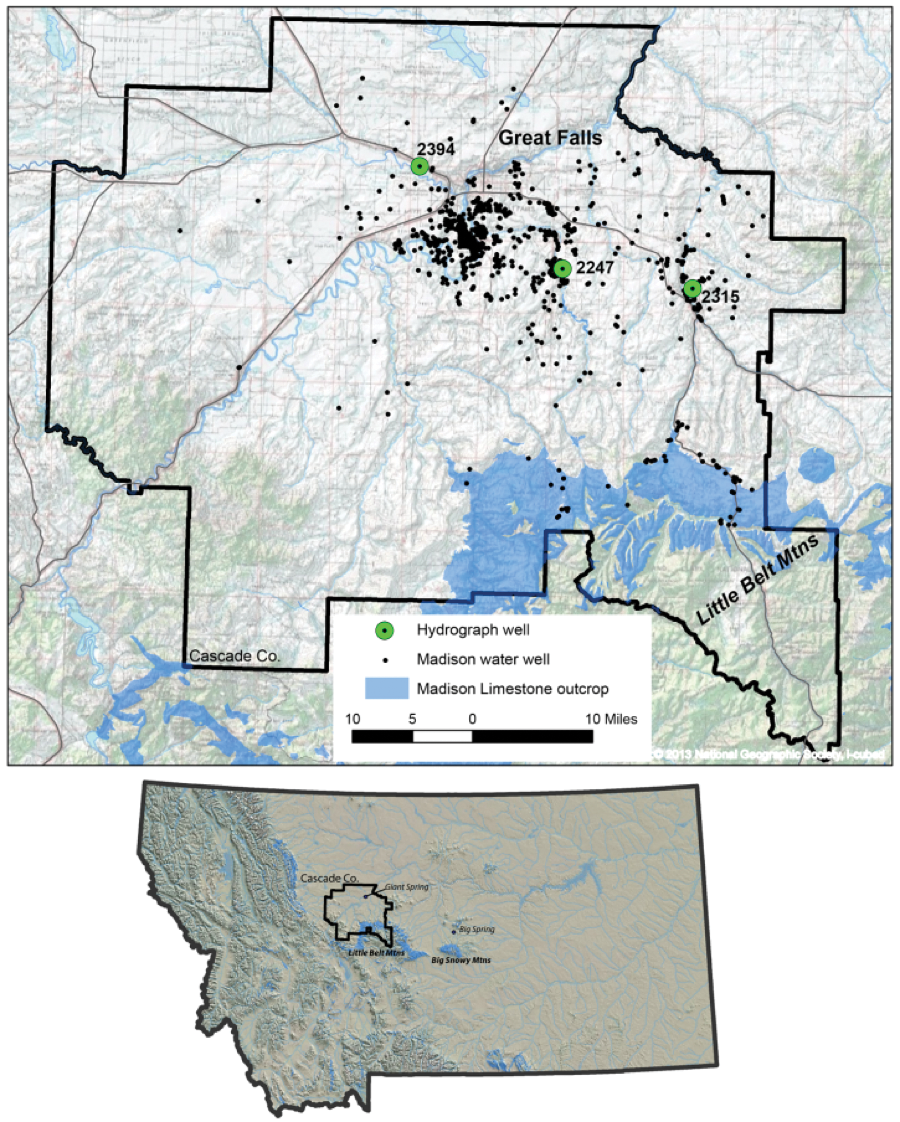
In Cascade County, between the Little Belt Mountains and the Missouri River near Great Falls, more than 900 relatively low-use wells use the Madison Limestone aquifer (Figure 3-18). Between 1995 and 2005, water levels in Madison Limestone aquifer observation wells near Great Falls dropped by about 30 ft (9 m), while the number of Madison Limestone-aquifer wells nearly doubled from about 400 to 800 (Figure 3-19) (MBMGb undated).
|
|
|
Figure 3-18. More than 900 wells (black dots) obtain water from the Madison Limestone aquifer near Great Falls. The Madison Limestone is exposed at the surface in the Little Belt Mountains (blue area on map), but is more than 400 ft (120 m) below the surface at Great Falls (MBMGb undated). |
|
|
|
Figure 3-19. Between 1995 and 2005, the number of wells drilled into the Madison Limestone aquifer around Great Falls nearly doubled. During the same period, water levels in the aquifer dropped by 30 ft (9 m). However, this was also a dry period, as indicated by the departure from average precipitation plot above. Water levels recovered following several wet years, even though wells continued to be drilled into the aquifer. Location of the hydrograph wells is shown in Figure 3-18. |
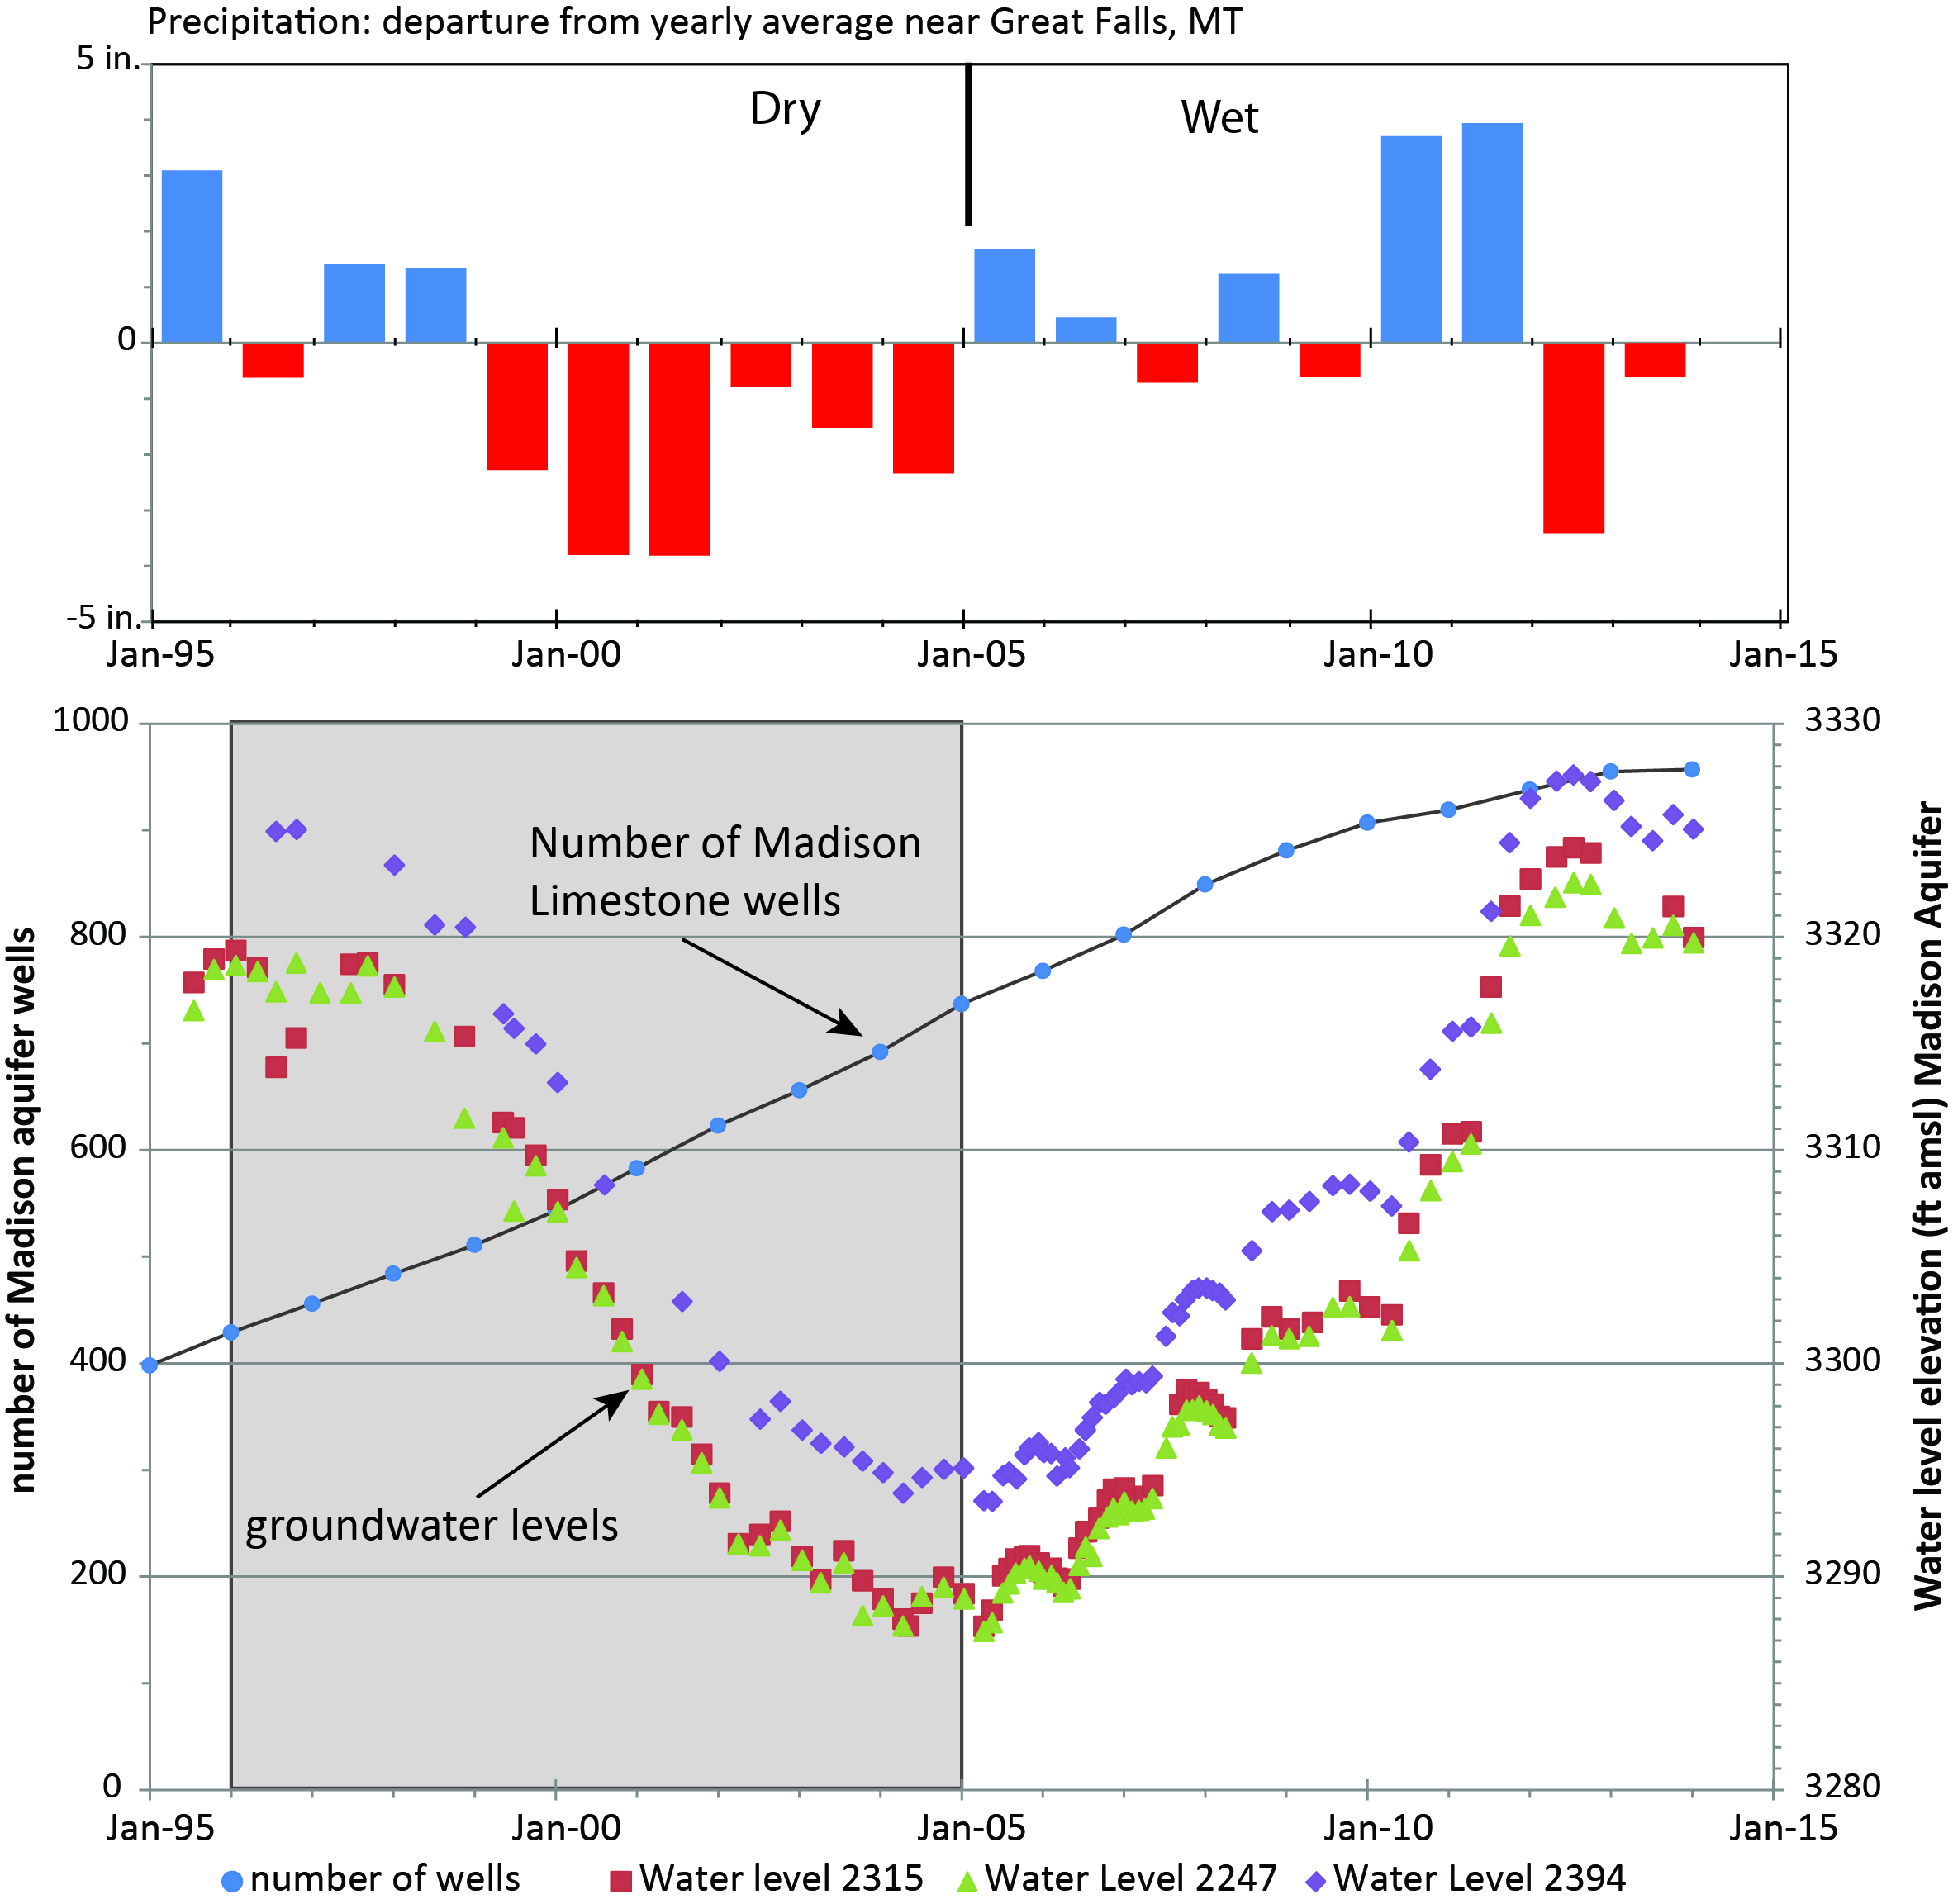
The decrease in water levels from 1995-2005 suggested that wells were removing water from the aquifer faster than it was being replenished. However, since 2005 water levels have climbed to elevations higher than those in 1995 even though new wells continued to be drilled into the Madison Limestone aquifer. This increase in water levels matches an increase in precipitation observed during that same period (Figure 3-19) and suggests that climate—and specifically mountain precipitation—as and is the primary driver of Madison Limestone aquifer water levels (i.e., groundwater replenishment and storage). The average annual precipitation from 1995-2005 was below average, supporting that conclusion. If small domestic withdrawals continue to characterize use in the Madison Limestone aquifer, we can expect the Madison Limestone aquifer to follow short- and long-term patterns in mountain precipitation that result from future climate change. However, if changes in climate and/or future development result in higher demand and higher capacity withdrawals, we may begin to see long-term declines, regardless of precipitation patterns.
Irrigation-supported alluvial aquifers will likely be resilient to climate change
Alluvial aquifers recharged by irrigation are expected to be resistant to climate impacts. More than 7000 miles (11,300 km) of irrigation canals lace Montana’s river valleys and alluvial terraces. These canals, which are mostly unlined, carry about 10.5 million acre-feet (1.3x10¹⁰ m3) of surface water each year to irrigate about 2 million acres (0.8 million ha).
In these valleys, losses from irrigation canals and seepage from irrigated fields constitute a significant fraction of aquifer recharge. Groundwater levels in such areas typically start rising during April and May when irrigation begins, remain elevated from midsummer to the end of the irrigation season, and then decline to an annual minimum just before the next growing season. This response is observed throughout the irrigated valleys in Montana.
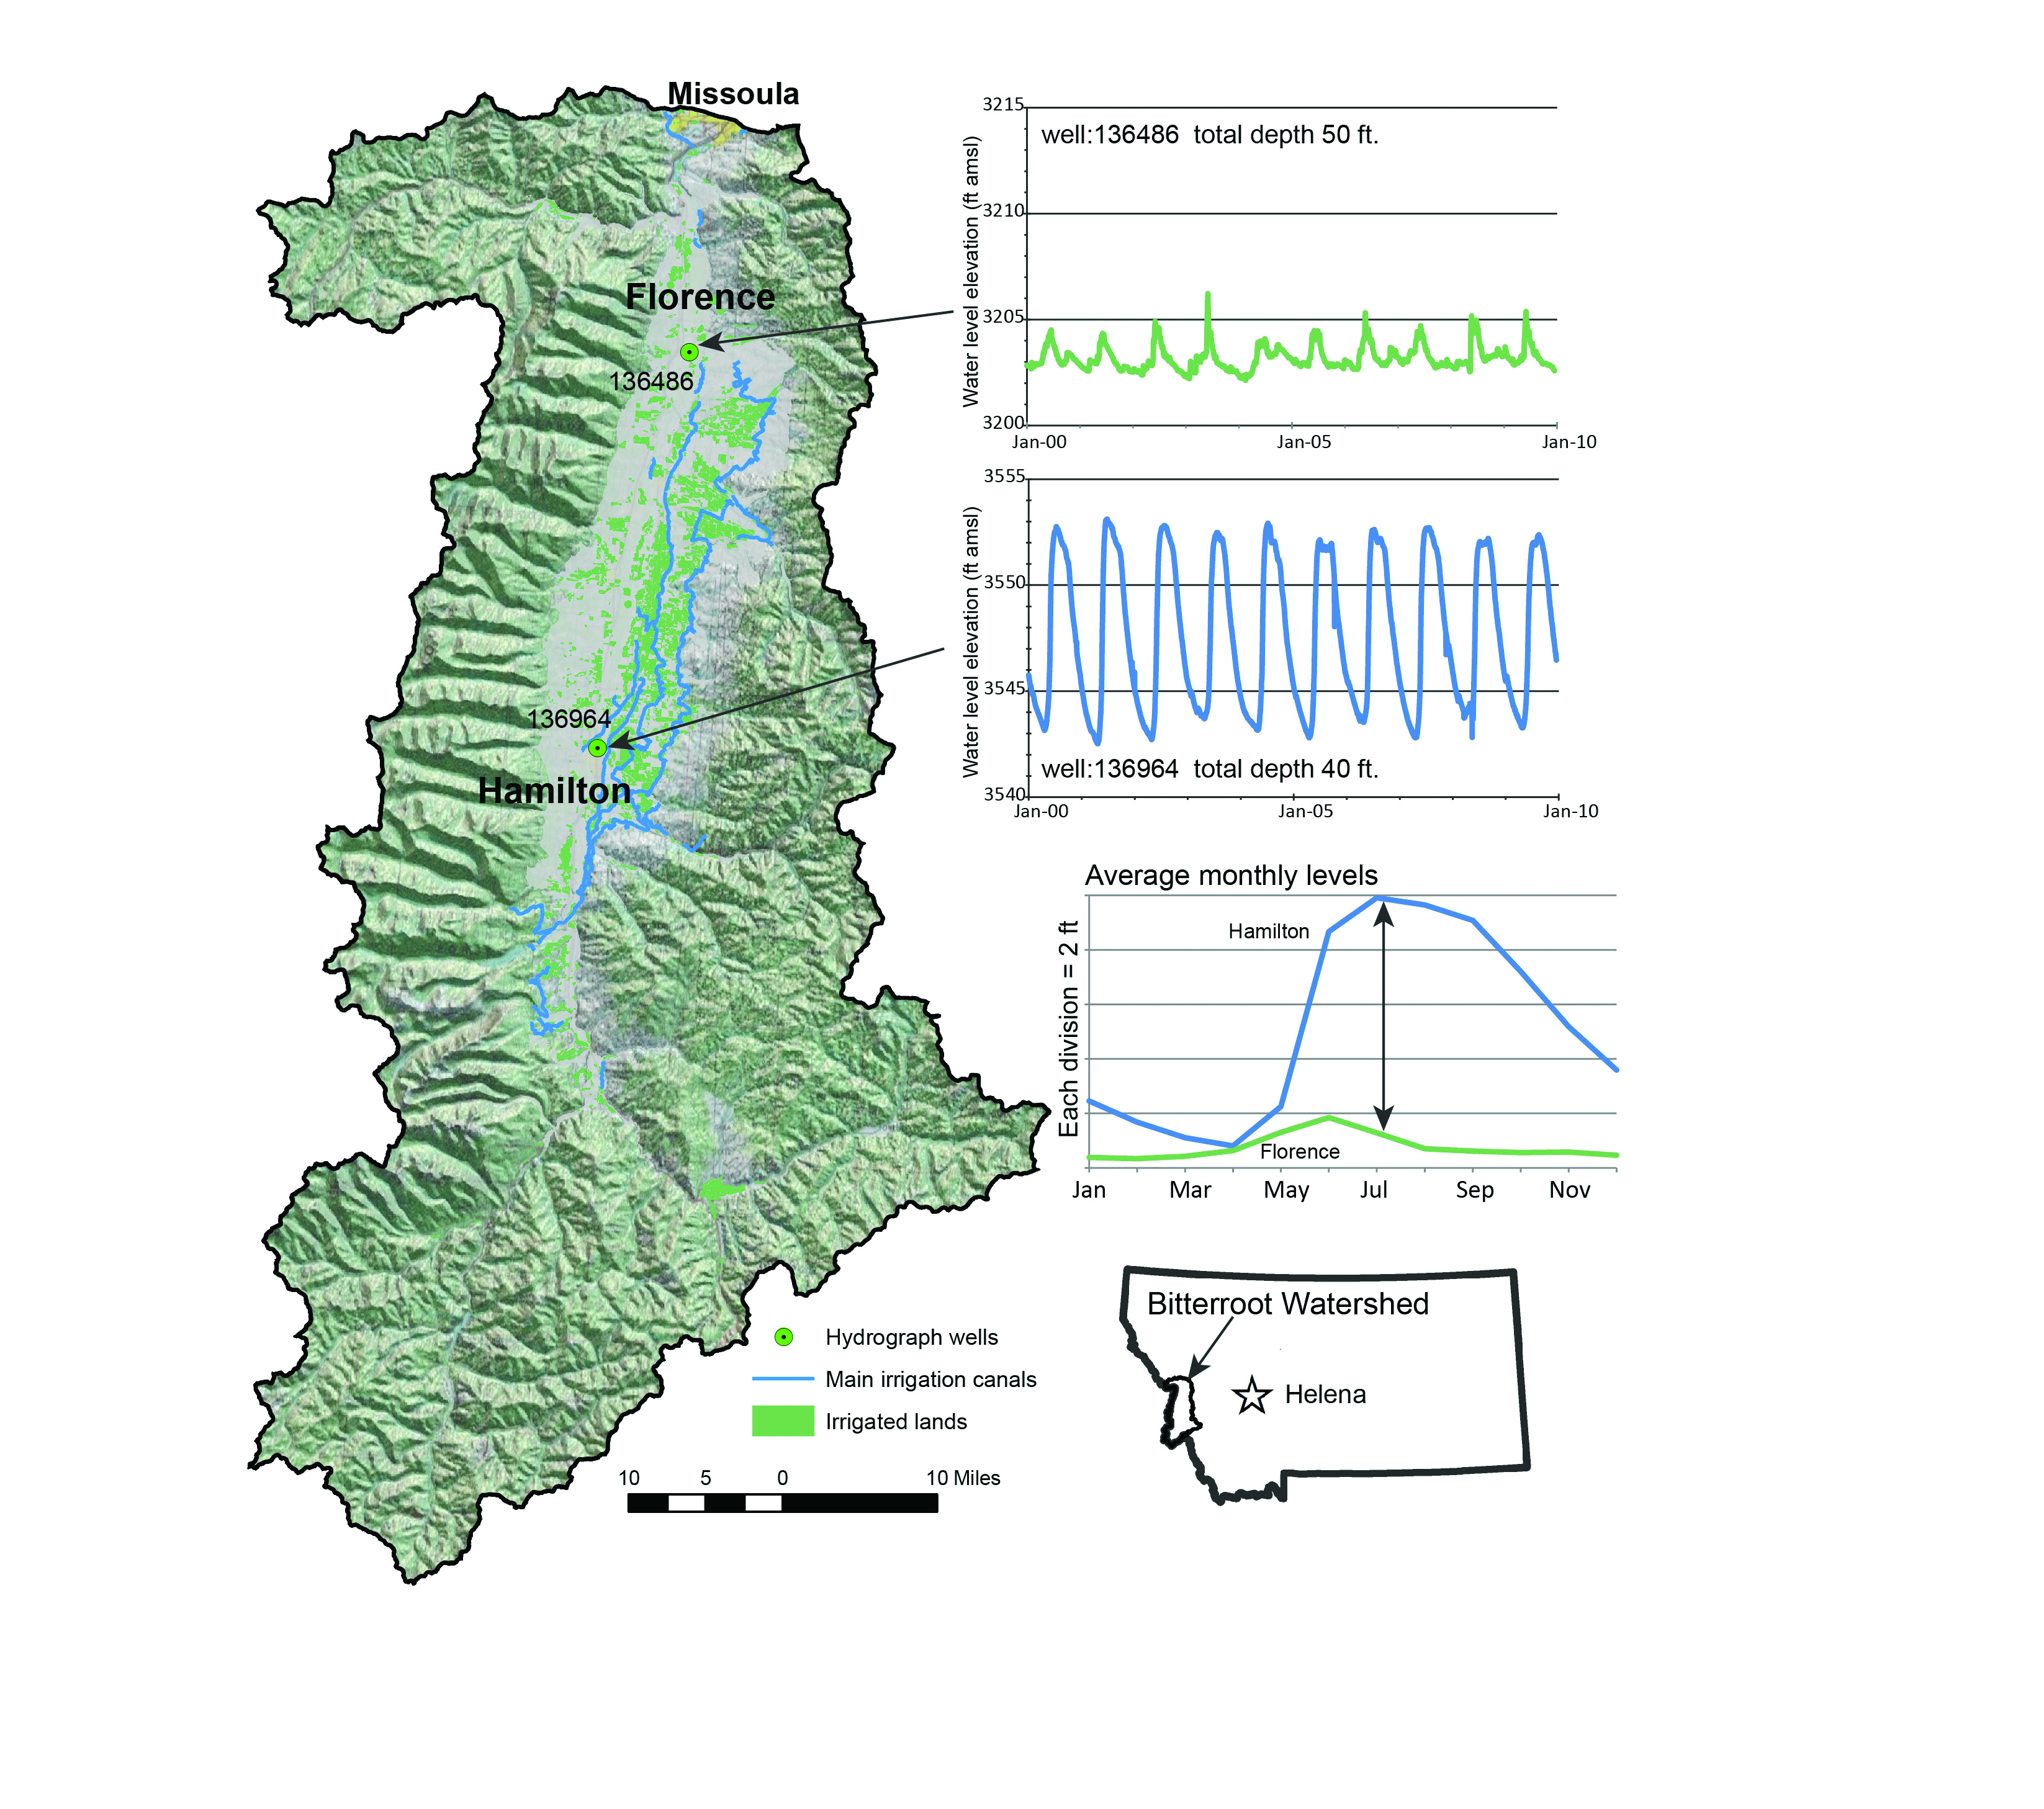
Hydrographs from two Bitterroot Valley wells from the same aquifer demonstrate this behavior, and thus highlight the significance of irrigation recharge and the resilience of irrigation-supported aquifers to climate variability (Figure 3-20):
- A well from an irrigated area near Hamilton shows that groundwater levels rise quickly at the onset of irrigation, remain elevated throughout the irrigation season, and then decline in the late summer or fall when irrigation ceases.
- A well distant from irrigation near Florence shows a far different water-level response, which is synchronized with interannual and seasonal variation in Bitterroot River flow. Here, water levels peak close to when streamflow peaks, and then gradually fall back to a base level.
On average, the annual water-level fluctuation in the Hamilton well is nearly 10 ft versus 2 ft (3 m versus 0.6 m) for the Florence well. The timing and the magnitude of the seasonal fluctuations in the Hamilton well are consistent from year to year. This consistency demonstrates that interannual climate variability does not affect groundwater recharge or storage in this irrigated area. However, future improvements to irrigation infrastructure aimed at increasing the efficiency of water delivery are likely to greatly impact the extent of incidental recharge related to irrigation. Such changes will make alluvial aquifers such as that near Hamilton less resistant to climate change influence, in turn affecting groundwater contributions to streamflow in affected areas.
|
|
|
Figure 3-20. Hydrographs for two wells completed in the same aquifer near the Bitterroot River show very different responses. The well near Hamilton is downgradient from several irrigation canals and irrigated fields; the well near Florence is not located near irrigation. The average monthly water levels show the difference in seasonal response of groundwater levels and highlight the importance of irrigation water as a source of recharge to the shallow aquifers (MBMGb undated). |
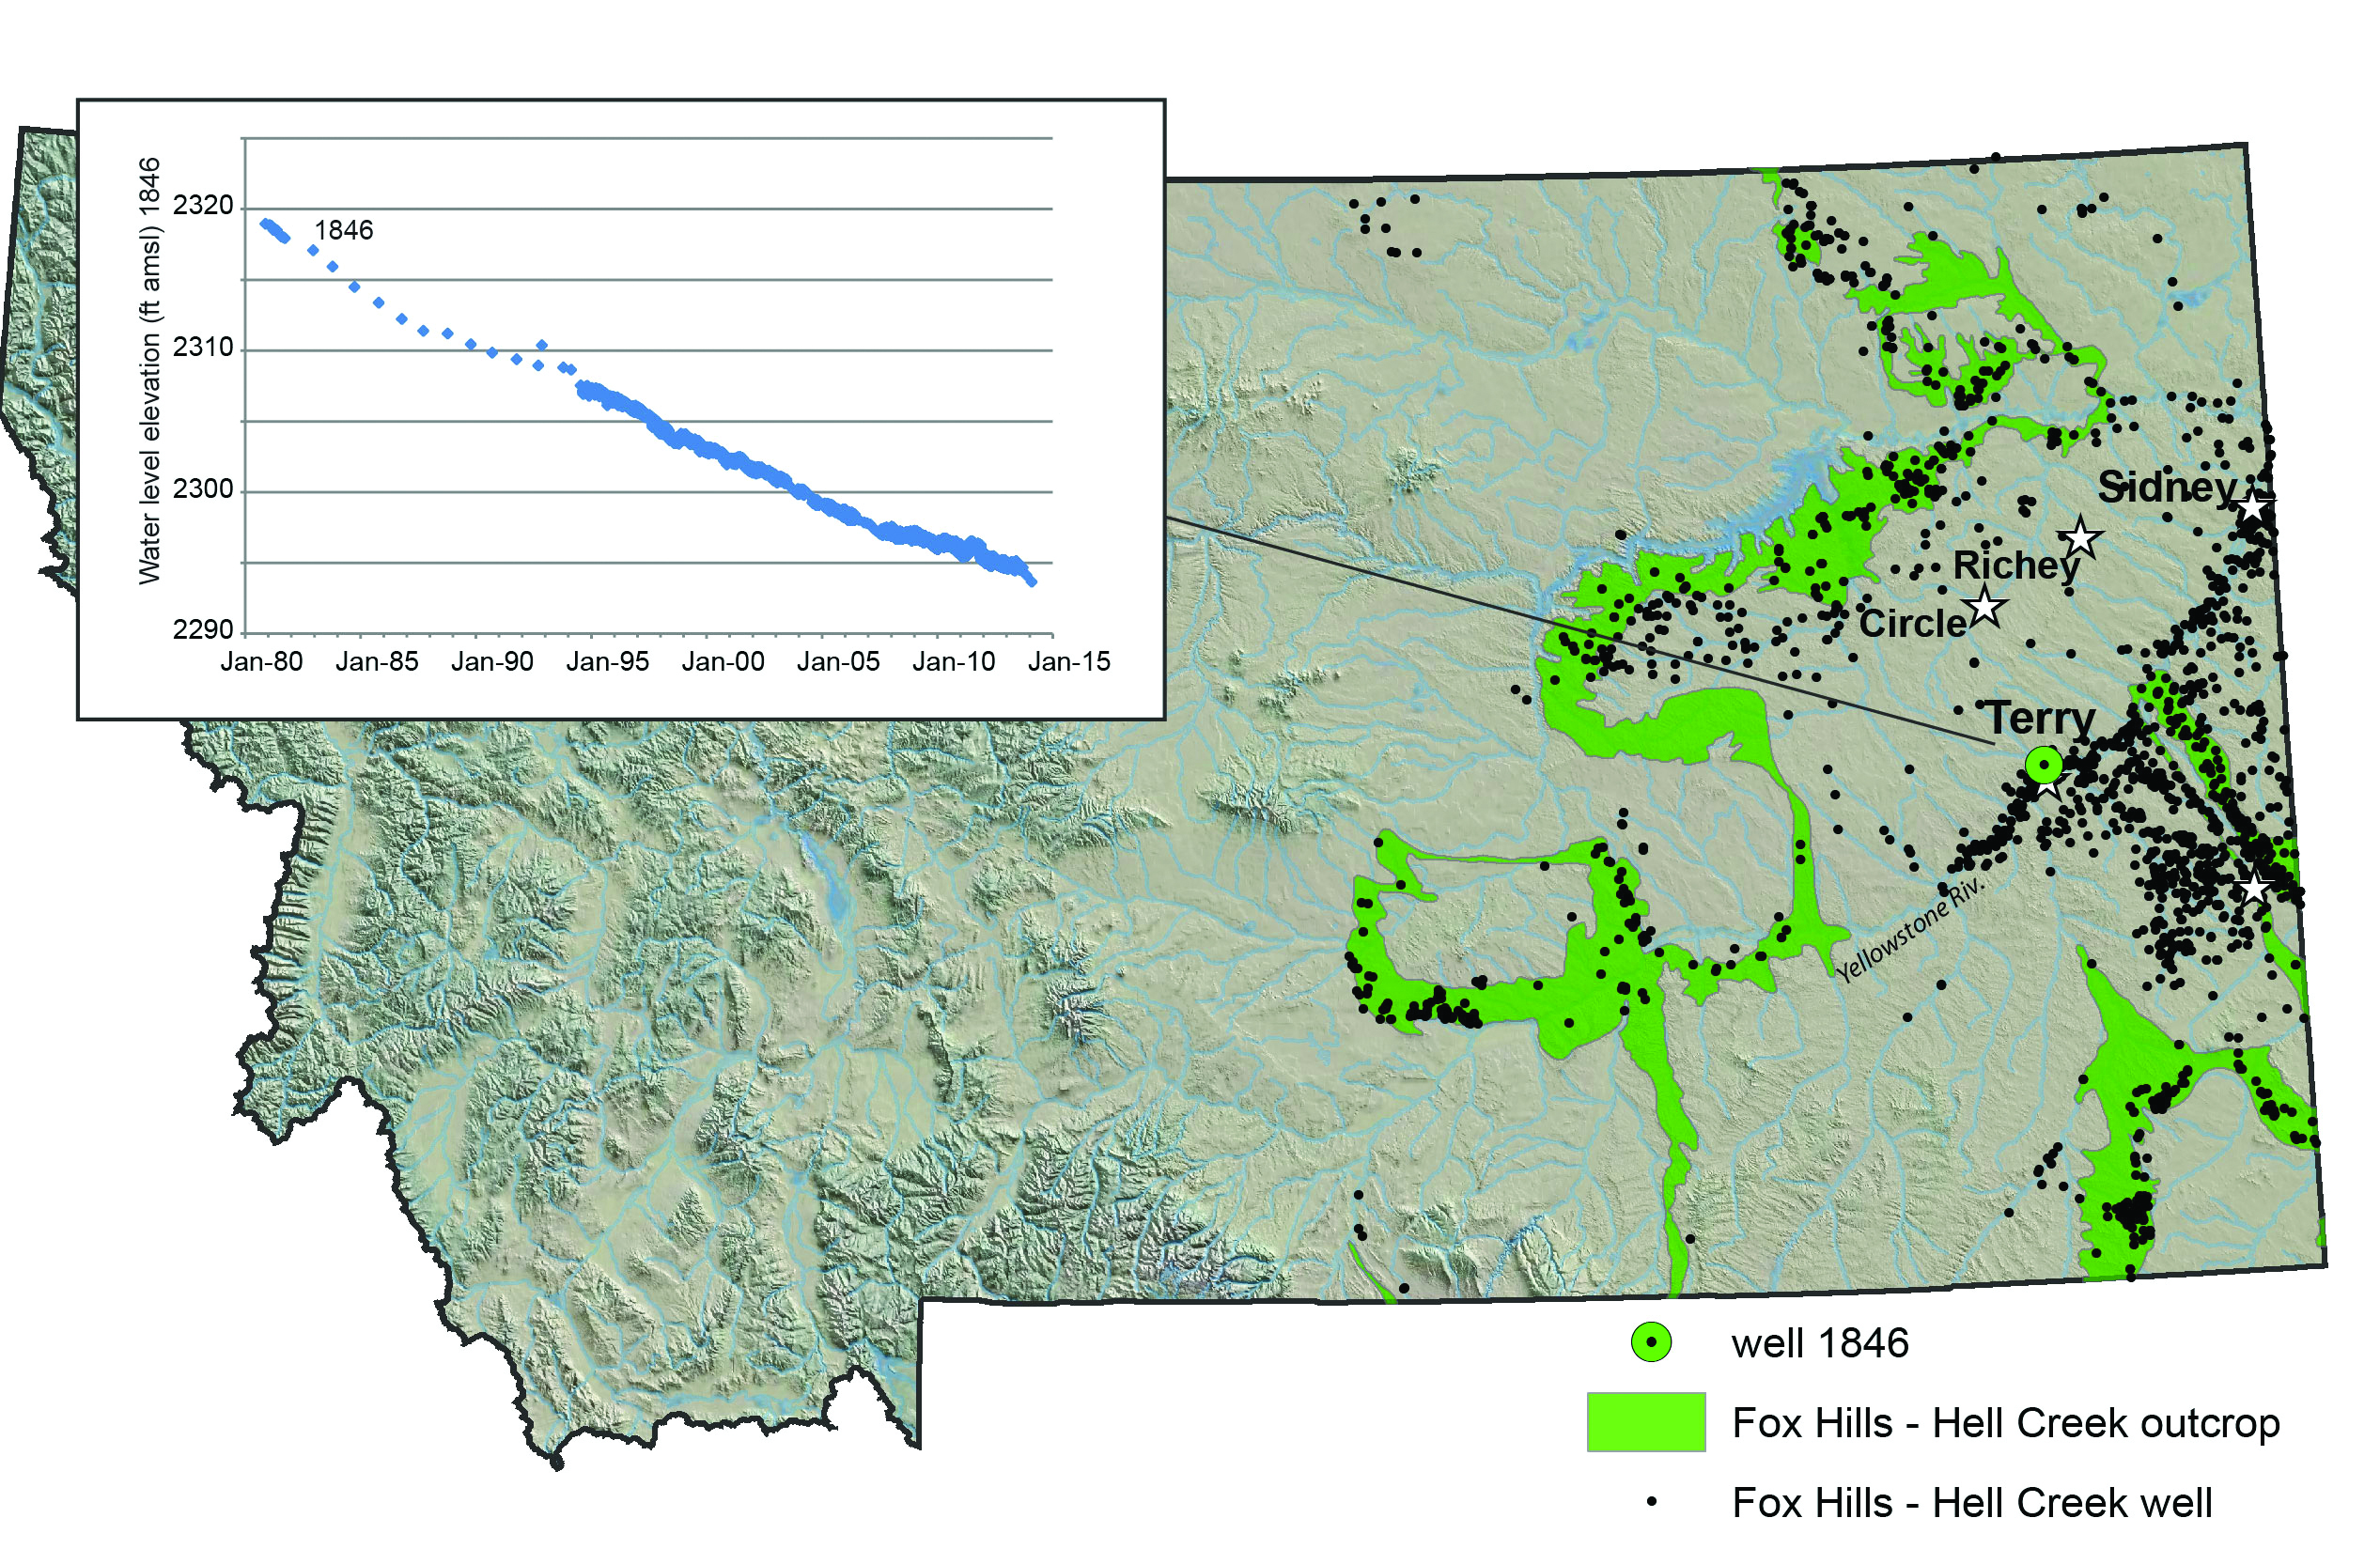
Fox Hills–Hell Creek aquifer, impacted by user withdrawals
Groundwater depletion occurs when the rate of groundwater recharge is less than the rate of discharge. The Fox Hills–Hell Creek aquifer underlies most of the eastern third of Montana and receives recharge from relatively narrow surficial exposures. Although the aquifer can be as much as 2000 ft (600 m) below the land surface, it provides water for domestic and livestock watering purposes, as well as municipal water for the towns of Baker, Circle, Lambert, and Richey.
In the lower Yellowstone River basin, the Fox Hills–Hell Creek aquifer serves about 1500 wells (Figure 3-21). The widespread use of the aquifer has resulted in persistent water-level declines, especially in the Yellowstone River valley. The hydrograph from observation well 1846 near Terry shows declining water levels of about 25 ft (7.6 m) during the past 33 yr (inset of Figure 3-21). The groundwater hydrograph shows no response to local climate variability and suggests that water use currently overwhelms or masks any variability related to climate. Projected shifts in temperature and precipitation are likely to reduce diffuse recharge to the Fox Hills–Hell Creek aquifer and accelerate the current depletion by water users. Increased demand on the aquifer will also occur with a warmer climate.
Groundwater systems are characterized by high storage capacity relative to inflows and outflows (Alley 2016). This characteristic will allow groundwater storage to play a key role in dampening the impact of climate variability on water resources (Taylor et al. 2013). Two strategies employing groundwater storage are:
- Coordinated use of groundwater and surface water resources.—Often referred to as “conjunctive use”, this approach stresses usage of surface water during wet periods and stored groundwater during dry periods to best maximize water availability.
- Managed or artificial groundwater recharge with excess surface water.—The use of aquifers as natural storage reservoirs for later withdrawal helps avoid evaporative loss, ecosystem impacts, and other problems associated with large, surface-water reservoirs.
Both strategies require comprehensive hydrogeologic analysis due to the uncertainty and variability of the climate and sub-surface conditions.
The demand for groundwater is likely to increase in the face of projected climate variability and change (Brown et al. 2013) (see Climate chapter). Whether groundwater will be utilized to help meet future water demand will depend not only on the physical availability of groundwater, but also on its legal availability. Surface water and groundwater are managed as a single resource in Montana and both are subject to restriction based on the water rights doctrine of prior appropriation.
Effective management responses require information, including:
- specific knowledge of the hydrogeology for many aquifers across the state to assess the impact of climate change on groundwater resources and develop adaptive strategies; and
- long-term monitoring of groundwater levels, groundwater use, and surface-water flow to establish baseline properties and conditions for predicting change.
DROUGHT
Key Messages
Multi-year and decadal-scale droughts have been, and will continue to be, a natural feature of Montana’s climate [high agreement, robust evidence]; rising temperatures will likely exacerbate drought when and where it occurs. [high agreement, medium evidence]
Changes in snowpack and runoff timing will likely increase the frequency and duration of drought during late summer and early fall. [high agreement, medium evidence]
Drought is a recurrent climate feature that occurs throughout the world, although it varies substantially from region to region. Drought can have broad and potentially devastating economic and environmental impacts (Wilhite 2000); thus, it is a topic of ongoing, statewide concern.
Through time, Montana’s people, agriculture, and industry, like its ecosystems, have evolved with drought. Today, many entities across the state address drought, including private and non-profit organizations, state and federal agencies, and landowners, as well as unique watershed partnerships. These groups incorporate drought preparedness and management goals into Montana water policy (see Building Drought Resilience sidebar).
Drought is a complex phenomenon, driven by both climate and human-related factors. Although a clear definition of drought is elusive, most definitions fall into four interrelated categories:
- meteorological drought, defined as a deficit in precipitation and above average evapotranspiration that lead to increased aridity;
- hydrological drought, characterized by reduced water levels in streams, lakes, and aquifers following prolonged periods of meteorological drought;
- ecological drought, defined as a prolonged period over which an ecosystem’s demand for water exceeds the supply (the resulting water deficit, or shortage, creates multiple stresses within and across ecosystems);21 and
- agricultural drought, commonly understood as a deficit in soil moisture and water supply that lead to decreased productivity (in this assessment, we will treat this form of drought as an important component of ecological drought).
Here, we focus on hydrological drought, in keeping with the emphasis on water availability and streamflow.
Drought is also discussed in terms of its duration. This section will address both persistent drought, which we define as multiple years of below-average streamflow (within which individual seasons of above-average flow may occur); and seasonal drought, defined as below-average streamflow lasting months. In Montana, seasonal drought is most common and of greatest concern during the warm growing season in summer and early fall. We therefore refer to this as warm-season drought.
|
Building Drought Resilience in Montana In the past, Montana often addressed drought and flooding as temporary emergencies, with reactionary responses to an immediate crisis. Over the past decade, western water planners have learned that the best time to prepare for the impacts of drought or flooding is before those events occur. Thus, they have developed plans advocating a proactive hazard management approach. Today, Montana’s drought planning efforts take this approach, seeking to apply foresight, commitment, technology, and cooperation to diminish the impacts of drought. For example, water managers and users now employ improved short-term drought forecasting methods to better plan for and mitigate drought impacts. Even so, our forecasting abilities must further improve for Montanans to better prepare for short-term variation in weather patterns and expected long-term impacts associated with climate change.
Canoeing the Jefferson River. Photograph courtesy of Scott Bischke.
|
|||
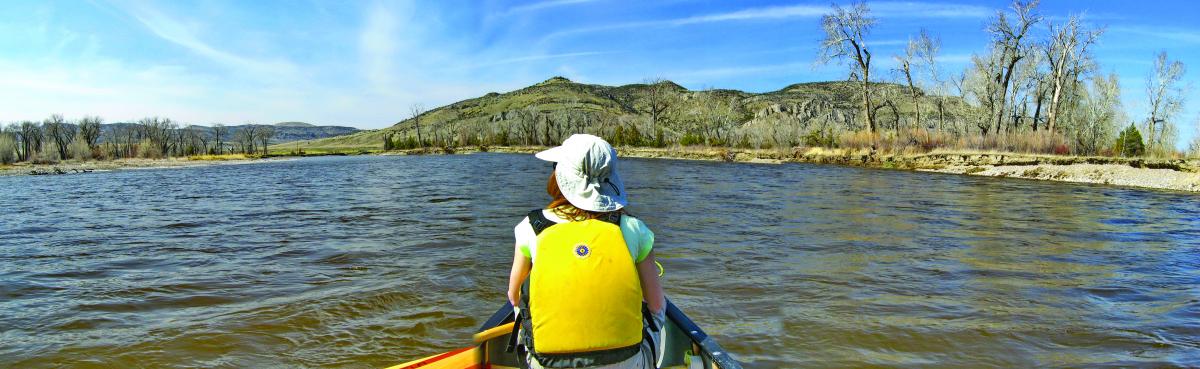
|
National Drought Resilience Partnership Montana Demonstration Project Through the Montana Demonstration Project partners, Montana is forging new ground in bringing together agencies, resource managers, and communities to plan for drought impacts and build drought resilience within watershed communities. Teaming with the National Drought Resilience Partnership—a collaborative of federal and state agencies, watershed stakeholders, and non-governmental organizations—the Montana group is working to leverage and deliver technical, human, and financial resources to help address drought in the arid West. The team selected the Missouri Headwaters Basin in southwest Montana for a national demonstration project. This basin experiences frequent drought, plays an important role in landscape connectivity in the Northern Rockies, and faces rapidly changing population and land use. The Montana Demonstration Project partners are working collaboratively to engage and train community-based drought coordinators to lead planning, mitigation, and project implementation in each of the eight watersheds in the basin. The individual watershed planning efforts will provide the basis for a scaled-up, integrated Headwaters Basin plan. This unique partnership is successfully demonstrating a) the value of enhanced coordination, and b) how to effectively leverage federal, state, and private resources to build community and ecosystem resilience to prepare and adapt to a changing climate. Text contributed by Ann Schwend, MT DNRC.
|
Persistent drought
During the past century, Montana experienced significant periods of persistent drought in 1917-1919, the late 1920s to early 1940s (the Dust Bowl droughts), the 1950s, the late 1980s to early 1990s, and the early 2000s (Figure 3-13). Most consider the Dust Bowl drought to be the worst multi-year drought in the observational record in Montana.
While these major droughtss affected all of Montana—and indeed much of the West—the severity, duration, and timing of each drought varied across the state (Figure 3-13), including in their influence on the larger river basins (MT DNRC 2015). In the 1950s, for example, rivers east of the Continental Divide show multiple years of below-average flow, while the Clark Fork at Saint Regis experienced above-average flows during the entire decade.
Studies of tree-ring-based reconstructions of drought, snowpack, and streamflow offer important insights about the long-term history of drought, as well as the natural variability of climate over the last millennium (Jackson et al. 2009). Reconstructions of snowpack, streamflow, and drought indices show that wet and dry periods, persisting between 10-25 yr, occurred throughout the western US (Cook et al. 2004; Pederson et al. 2006; Pederson et al. 2011b). Further, tree-ring reconstructions of drought (using the Palmer Drought Severity Index) show that a) the frequency and duration of droughts in the West were greater prior to 1200 AD than during the 20th century, and b) the past 300 yr have been wet relative to the long-term average (Cook et al. 2004; Cook et al. 2010).
Regional and local factors that influence persistent drought
A complex interplay of climate, hydrologic and ecosystem processes, and human impacts influences drought. For this assessment, we focus on the first two. However, it is notable that humans significantly impact streamflow and water supply, and, hence, patterns of drought. Those impacts must be included in future efforts to assess drought risk, manage water use and supply, and build resilience to climate change.
Natural variability in precipitation and temperature will continue to characterize Montana’s climate in the future, resulting in droughts of varying duration and intensity. Within the context of this natural variability, human-driven changes in temperature and precipitation will affect future patterns of drought in Montana. For this assessment, we focus on important factors, described below, that affect the natural variability of persistent drought in Montana, as well as potential shifts in drought occurrence as a result of a changing climate.
- Precipitation.—Interannual variability in precipitation is widely accepted as the primary climate factor driving drought. While annual precipitation is expected to increase in many parts of Montana, precipitation projections are less certain than changes in temperature, making accurate assessment of future drought risk based on those projections difficult (Cook et al. 2014). Additionally, the total volume of annual precipitation is only a single factor that helps to predict drought; the frequency, intensity, character, and seasonality of precipitation are equally important (Sheffield and Wood 2008). For example, shifts from snow to rain in headwater areas and potential decreases in summer precipitation could have negative consequences for water supply in the seasons of highest water demand (see snowpack, snowmelt and runoff, and seasonal drought sections).
- Temperature.—Temperature variability can also affect drought, although its influence is much smaller than that of precipitation (Dai 2011; Livneh and Hoerling 2016). Historically, temperature appears to be a secondary response to drought, rather than an initial driver. In the prolonged absence of precipitation, soils dry out and the fraction of energy that once went into evaporation heats the land surface and forces temperatures higher (Lukas et al. 2014). In severe circumstances, a positive feedback then occurs, with high temperatures further exacerbating the drought. Several recent studies suggest that, while precipitation remains the primary driver of drought, the influence of high temperatures on drought is increasing, as shown for recent droughts in California and the Great Plains (Hoerling et al. 2014; Wang et al. 2014; Livneh and Hoerling 2016).
- Evapotranspiration and drought.—Rising temperatures cause increased rates of evaporation and plant transpiration, which together are referred to as evapotranspiration. This increased evapotranspiration will be one of the most significant influences on drought resulting from rising temperatures. In the absence of increased precipitation, higher rates of evapotranspiration can move substantial amounts of water back to the atmosphere (Figure 3-1), leading to reductions in streamflow, soil moisture, and groundwater recharge. Recent studies suggest a) a global trend toward drying of land surfaces since the 1980s (Sheffield and Wood 2008; Dai 2011; Dai 2013), and b) an increase in water deficits in the Northern Hemisphere since 2000 (McCabe and Wolock 2015), both resulting from rising temperatures and elevated levels of evapotranspiration. However, regional changes in evapotranspiration are less certain than global trends (Cook et al. 2014). Additionally, quantifying the effects of climate change on evapotranspiration—and subsequently to the water balance—is complex; so much so that future projections of drought risk vary significantly (Zwiers et al. 2013; Sheffield et al. 2012) depending on assumptions made about how evapotranspiration will respond to climate change. Among other factors, complexity results from uncertainty in how plants will respond to elevated greenhouse gases and changes in water availability, as shown below.
- Evapotranspiration is expected to increase with warming and, yet, plants can respond to elevated atmospheric CO2 (that occurs in parallel with warming) by using water more efficiently leading to less water loss through evapotranspiration (Tesemma et al. 2015; Swann et al. 2016).
- Evapotranspiration is limited by water supply and, thus, long-term or seasonal increases in aridity will constrain potential increases in evapotranspiration caused by rising temperatures (Huntington and Niswonger 2012; Trenberth et al. 2014).
Surface water stored in reservoirs provides important warm-season water supplies in much of Montana, particularly in central and eastern areas that receive the lowest levels of average annual precipitation. A significant percentage of this stored water is currently lost to evaporation. For example, 7% of the water budget for the lower Missouri River Basin evaporates annually from Fort Peck Reservoir (MT DNRC 2014a). Additionally, in the many arid parts of Montana, runoff efficiency—the proportion of precipitation converted to streamflow—is already low (e.g., 4% of precipitation in the Musselshell leaves the basin as streamflow [MT DNRC 2014a]). Higher rates of reservoir evaporation due to rising temperatures could exacerbate both problems, resulting in reduced water supply and decreased ability for reservoirs to buffer summer periods of low streamflow.
Drought and the dominant role of sea-surface temperatures
As discussed in the Climate chapter, large-scale atmospheric circulation patterns connected to changes in sea-surface temperatures strongly influence natural variations in precipitation and temperature (e.g., Cayan et al. 1999; Mantua and Hare 2002). Shifts in sea-surface temperatures in both the Pacific and Atlantic oceans can produce conditions that lead to periods of drought (McCabe et al. 2004, Seager and Hoerling 2014).
A deeper understanding of these circulation patterns is required to predict persistent drought in Montana and the West accurately (Cook et al. 2007; Trenberth et al. 2014). The relationship between changes in sea-surface temperature and drought is complicated by many factors, including a) the large number of meteorological or other environmental phenomena involved; b) the widely varying timescales and large distances those phenomena act over; and c) the fact that those phenomena can amplify or dampen each other’s effect on weather and climate (Schubert et al. 2016). Indeed, our current understanding of how sea-surface temperatures respond to climate change is relatively weak (see Climate chapter), severely limiting our ability to forecast persistent drought (Dai 2011; Seager and Hoerling 2014; Trenberth et al. 2014).
Likelihood of persistent drought
Given the known occurrence of long-term drought in Montana over the observed historical and paleo-climate records, there is very high likelihood that persistent drought will continue to be part of Montana’s future climate, regardless of the effects of climate change.
There is relatively little consensus about how climate change will affect the incidence of persistent drought at global and regional scales, in large part due to the uncertainties discussed above. In addition, exclusion of human-related impacts such as irrigation, land use, and water diversion from most current climate models makes reliable projection of drought even less certain (Sheffield and Wood 2008). Across the western US, there is considerable variation in projected future drought risk, both regionally and among climate models.
Projections for the northern Rocky Mountains and northern Great Plains, including precipitation only, suggest that long-term droughts will not increase in frequency (Strzepek et al. 2010). However, projections for these regions that incorporate other changes in climate (such as temperature and evapotranspiration) predict increasing drought frequency in the latter half of the 21st century (Strzepek et al. 2010; Dai 2011; Cook et al. 2014), suggesting an increasing influence of temperature on drought. Amidst debates over changes in drought frequency, there is widespread agreement that rising temperatures will exacerbate drought when and where it occurs, leading to more rapid onset of drought and increased intensity (Strzepek et al. 2010; Peterson et al. 2013; Lukas et al. 2014; Trenberth et al. 2014). Such effects may already be occurring in some areas (Lukas et al. 2014).
In addition, strong evidence exists that climate change is likely to impact the occurrence and severity of warm-season drought (Cook et al. 2004; Sheffield and Wood 2008; Pederson et al. 2011a; Dai 2013; Trenberth et al. 2014).
Warm-season drought
Drought during the warm season is a common phenomenon in arid and snowmelt-dominated regions in the West, including much of Montana. In these areas, the majority of precipitation arrives as snow in winter and melts in spring to produce high streamflow that generally diminishes through summer. Even for areas in eastern Montana that receive most of their annual precipitation in spring and summer, water in larger watersheds is predominantly derived from mountain snowpack (MT DNRC 2014b), and thus streamflow there follows a similar seasonal pattern (Figure 3-6).
Warm-season drought can occur during years of persistent drought as well as years of average precipitation if, for example, high spring temperatures rapidly reduce snowpack. Changes in late-summer flows are likely to be more critical to people than changes in annual flows because the demand for water is highest in summer. Thus, understanding current trends and potential changes in warm- season drought is essential for building water resource resilience in Montana.
Observed trends in warm-season drought
Evidence for declining summer flows across much of the West comes from large-scale studies in the Sierra Nevada; the Columbia, Colorado (Das et al. 2011), and Upper Missouri basins (Norton et al. 2014); and many small watersheds in western Montana, Idaho, Alberta, and British Columbia (Rood et al. 2008; Leppi et al. 2012). Widespread declines in August streamflow and increased frequency of low flows have been reported in both pristine and regulated watersheds of western Montana, Idaho, and Wyoming, with the most pronounced trends in pristine sites (Leppi et al 2012).
Most studies link declining summer flows with increased winter and spring temperatures, reduced snow accumulation (see snowpack section), and earlier snowmelt and spring runoff (see snowmelt and runoff section) (Rood et al. 2008; Kim and Jain 2010; Leppi et al. 2012). The problems of declining summer flows are compounded in watersheds with significant water use.
Factors associated with low summer flows in Montana
Here, we investigate factors associated with summer low flows in our focal rivers by examining correlations between historical (1929-2015) climate and August streamflow (e.g., the relationship between winter or spring precipitation and August flow; Figure 3-22). While this investigation cannot be used to predict August streamflow in the future, it can help reveal patterns of seasonal temperature and precipitation that tend to produce higher or lower summer flows. It should be acknowledged, however, that increased water use during the summer makes it harder to explicitly separate the effects of climate from water use.
Factors that determine August flows vary across the state.—In our focal watersheds, we find that for rivers fed primarily by mid- to high-elevation snowmelt (e.g., the Yellowstone at Billings, the Clark Fork at Saint Regis, and the Missouri at Toston), August flows have a strong positive relationship with winter (November-March) precipitation and a strong negative relationship with spring (April-June) temperatures. Thus, we can expect that years with low winter precipitation and high spring temperatures will lead to low August flows. In addition, for the Yellowstone at Billings, when recent years (1980-2015) are compared to the entire period of record (1929-2015), the relationship between high spring temperatures and low August flows (not pictured in Figure 3-22) is strengthened, a finding consistent with literature suggesting that recent warming is exacerbating low summer flows (Hay et al. 2011; Leppi et al. 2012; Huntington and Niswonger 2012).
Although these three rivers receive the vast majority of their annual precipitation in winter and spring (70-78%), summer precipitation can also have an important influence on August flows (Figure 3-22). For the Marias River near Shelby and the Musselshell River at Mosby, August flows are lowest during years of high summer temperatures (Figure 3-22) and low summer precipitation. For the Marias River near Shelby, high spring temperatures also negatively influence August flows, likely because of accelerated snowmelt.
|
|
|
Figure 3-22. Relative influence of temperature and precipitation on August flows for the focal rivers of this assessment. In general, warmer temperatures have a negative influence on August streamflow, while precipitation has a positive influence on flows. Differences exist among seasons and rivers. |
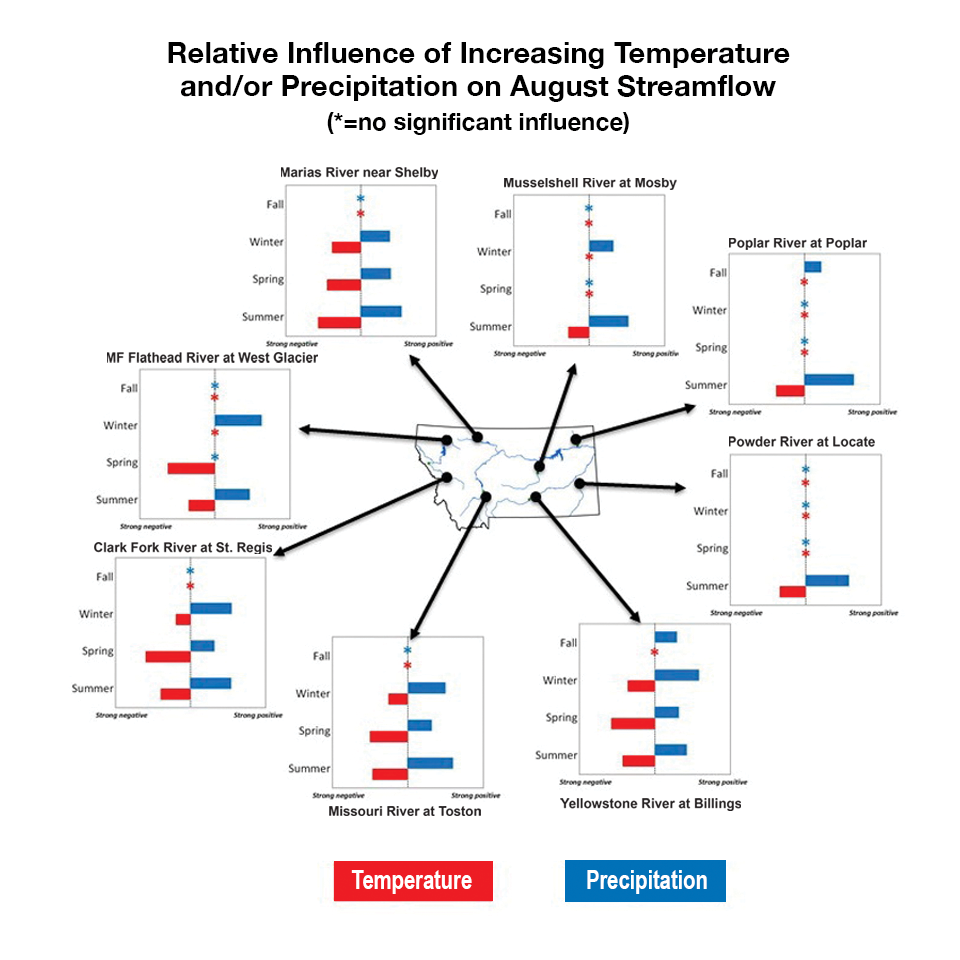
For the two focal rivers in eastern Montana (Powder River near Locate and Poplar River near Poplar), August flows are most dependent upon summer precipitation (Figure 3-22), likely because eastern Montana receives a higher percentage of precipitation in spring and summer relative to the other parts of the state.
Climate projections and warm-season drought.—Future changes in climate are likely to increase the incidence of warm-season drought (Cook et al. 2004; Sheffield and Wood 2008; Pederson et al. 2011a). Based on the relationships between climate and August flows described above, projected warming in winter and spring will likely lead to lower summer flows and/or low flows of longer duration. High warm-season temperatures show a negative relationship with August flows in several watersheds, an effect that is likely to be magnified with rising summer temperatures and the projected increase in number of days over 90°F (32°C) (see Climate chapter).
Any potential decline in summer precipitation is also projected with medium confidence for many areas in Montana (see Climate chapter). Small decreases in summer precipitation could exacerbate the occurrence and severity of warm-season drought because a) many smaller watersheds in eastern Montana are fed more by spring and summer precipitation than by winter snowpack (MT DNRC 2014b), and b) low August flows show a strong correlation with summer precipitation in all focal watersheds.
Projected hydrographs for our focal watersheds demonstrate reductions in late-summer flows for all rivers except the Musselshell, although variation in the magnitude of change and projection confidence exists (see Figure 3-12). These projections, therefore, generally illustrate that a higher proportion of the annual flow will leave Montana watersheds earlier in the year, resulting in lower flows during the summer months. Lower flows are a concern for multiple reasons, as described below.
- Although Montana has experienced a long history of warm-season drought, projected changes in temperature and precipitation could have a substantial impact on the severity of warm-season drought in the future.
- Short-term drought during the season of highest demand can a) test water supply infrastructure, and b) have severe consequences for human and natural systems (Luce and Holden 2009).
- Given the projected increases in streamflow during winter and spring, maintaining streamflows during warm season months will likely necessitate reconsideration of water storage practices and reservoir management.
- Changing seasonality of water availability will likely put additional stress on the rigid and legally encumbered water rights system, making it difficult to access water at critical times (Udall 2013).
- Changes in stream temperature due to lower flows and rising air temperature are likely to have catastrophic impacts on some aquatic species, with ripple effects on Montana’s important river-based recreation industry (see Warming Rivers and Streams sidebar).
|
Warming Rivers and Streams Montana’s 40,000 miles (64,000 km) of perennial rivers and streams support world-famous trout fisheries. They also provide habitat for rare and temperature-sensitive species like bull trout (Salvelinus confluentus), cutthroat trout (Oncorhynchus clarkii), and pearlshell mussels (Margaritifera margaritifera). Researchers have recently developed high-resolution stream climate maps (Isaak et al. 2016) based on extensive stream temperature data collected by several agencies across the state. The maps show that summer stream temperatures vary considerably throughout the state. Those temperatures generally reflect patterns in average air temperatures—usually being coldest in the high mountains and warmest at low elevations and in the eastern plains. Changes in climate described in this assessment, especially declining summer flows (Rood et al. 2008; Leppi et al. 2012) and increasing air temperatures (Pederson et al. 2010), have caused temperatures to increase in the state’s rivers and streams at the rate of 0.18-0.36°F (0.1-0.2°C/decade) (Isaak et al. 2012). Stream warming rates are slower than air temperature warming rates due to the buffering effects of groundwater, but any temperature increase can be important for cold-blooded aquatic species. Two ramifications of increasing stream temperatures follow. Fish moving upstream.—Studies already show that distributions of brown trout (Salmo trutta) and bull trout have shifted upstream as fish seek to access cooler habitats (Eby et al. 2014; Al-Chokhachy et al. 2016). In addition, warm-water fishes (e.g., smallmouth bass [Micropterus dolomieu]) have been caught with increasing frequency in historically cold sections of some rivers, such as the Yellowstone River near Livingston. Cold headwater streams are poised to provide important climate refuge for species requiring cold waters (Isaak et al. 2015). Possible changes in Montana fishing regulations.—In larger rivers at lower elevations, warming trends may result in more frequent fishing season closures and disease outbreaks, such as the mountain whitefish (Prosopium williamsoni) kill on the Yellowstone River in the fall of 2016 (MFWP 2016, Wright 2016). Some sections of rivers that currently support trout fisheries may transition gradually into bass fisheries. It is difficult to know precisely how much warmer Montana’s rivers and streams will become in this century, but across the state water temperatures will likely follow rising air temperatures.
Climate map showing average summer temperatures in Montana’s rivers and streams during historical baseline period of 1993–2011 (top panel) and a late-century scenario in which temperatures are warmer than historical conditions by 3.6°F (2.0°C; bottom panel). River segments colored red are usually too warm for popular cold-water species like trout. A more detailed version of this map, as well as the stream temperature data used in it, are available from the NorWeST website (USFS-RMRS undated). Sidebar text and figure contributed by Daniel J. Isaak, US Forest Service, Rocky Mountain Research Station. |
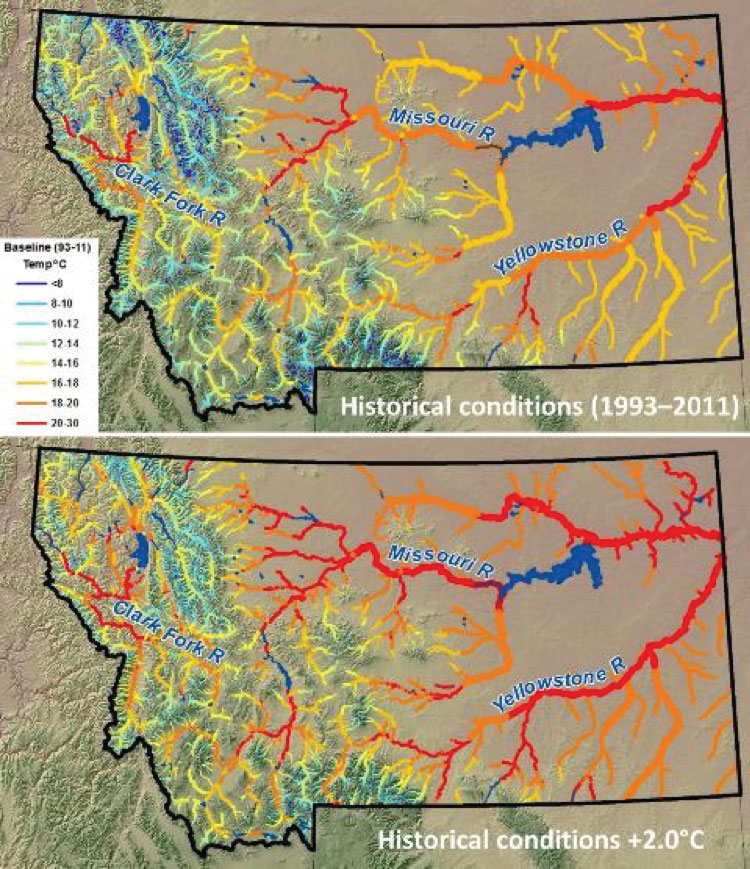
Flooding.—While drought likely represents the greatest persistent water-resource concern in Montana, flooding has also occurred regularly throughout the state’s history, resulting in loss of life and substantial damage to property, infrastructure, and riparian ecosystems. Flash flooding events typically occur with little warning, are difficult to predict, and are caused by a variety of climate and human-related factors. The geographical extent of flooding is often more limited than that of drought; flood history in Montana therefore varies significantly by watershed and basin (Table 3-3).
In Montana, flood events can occur at any time of the year, but the causes of flooding vary among seasons. Most spring floods are caused by rapid snowmelt, particularly during rain-on-snow events in which rain infiltrates and degrades the existing snowpack. The most severe and destructive floods in the state’s observational record have resulted from rain-on-snow events (Table 3-3) (Paulson et al. 1991; MT DNRC 2015) that occurred after a period of relatively cold weather. During these events, frozen soils prevent the infiltration of surface water into soils, resulting in greatly elevated runoff (MT DNRC 2015). In northwestern Montana, rain-on-snow events are one of the most frequent causes of annual maximum streamflows (MacDonald and Hoffman 1995; Ferguson 2000).
Natural variability in precipitation also plays a significant role in flooding in Montana, sometimes in combination with rain-on-snow events. For example, in the huge flood of June 1964, 13 inches (33 cm) of rain fell in 24 h near Augusta, Montana, nearing the average annual precipitation for the region in a single day. This record-breaking rainfall on a higher-than-average and late-melting snowpack along the Rocky Mountain Front caused the overtopping of the Gibson Dam on the Sun River, and the failure of Swift Dam on Birch Creek and Lower Two Medicine Dam on Two Medicine Creek. The flood caused extensive damage and resulted in 30 fatalities, all of which were on the Blackfeet Reservation.
Flood events can also occur in winter as a result of ice jams, which impede flow in the river channel and lead to floodplain inundation. These floods are most common east of the Continental Divide during persistent cold weather fronts. Interestingly, Montana has recorded more ice jam events than any other state in the continental US (US Army CRREL undated). Floods that occur during summers are generally caused by large convective rainstorms and are most common in the eastern plains, particularly in the lower Yellowstone River Basin.
Human factors play a significant role in modifying flood regimes. Activities, such as urbanization, forest clearing, wetland drainage, and stream channelization, tend to amplify flooding, while water management practices, such as reservoir storage operation, can often prevent or moderate the peak flows that lead to large floods (Kunkel at al. 2003; Rood et al. 2016). Consideration of these factors will be critical for preventing and mitigating floods into the future.
| Date | Area affected | Recurrence interval (yrs) | Description | Cause |
| June 1908 | Clark Fork Basin, Missouri headwaters | Unknown | Widespread and severe; worst flood until 1964; lives lost, 6 | Excessive spring rains and snowmelt runoff |
| Sept 1923 | Powder River basin | Unknown | Largest known discharge at Moorhead. | Intense rain |
| May-June 1948 | Clark Fork, Flathead, Kootenai basins | 25 to 50 | Severe | Intense rain and rapid snowmelt runoff |
| April 1952 | Milk River basin | 25 to >100 | Severe on Milk River main stem | Rapid snowmelt runoff |
| May-Jun 1953 | Missouri headwaters | 25 to100 | Moderate to severe | Intense rain and rapid snowmelt runoff |
| June 1964 | Missouri headwaters (Sun, Teton, Marias), Clark Fork basin |
50 to >100 | Worst on record; lives lost, 30 (all on the Blackfeet Reservation) | Intense rain and rapid snowmelt runoff |
| Jan 1974 | Kootenai River basin | 25 to >100 | Severe on several Kootenai tributaries | Intense rain and rapid snowmelt runoff |
| May-July 1975 | Missouri headwaters, Clark Fork basin | 25 to 100 | Severe in most areas affected in 1964 | Intense rain and rapid snowmelt runoff |
| May 1978 | Bighorn, Powder and Tongue basins | 10 to >100 | Severe on larger tributaries; lives lost, 1 | Intense rain and rapid snowmelt runoff |
| May 1981 | West-central Montana | 10 to >100 | Severe; centered on Helena | Intense rain and rapid snowmelt runoff |
| Sept 1986 | Milk River basin | 10 to >100 | Severe on larger tributaries; lives lost, 1 | Intense rain |
| June 1996 | Statewide | 50 to 100 | Ice jam flooding (Feb) in the Clark Fork and Yellowstone basins and widespread spring flooding | Intense rain and rapid snowmelt runoff |
| June 1997 | Statewide | 50 to 100 | Severe and widespread flooding impacting wide geographic area, | Record statewide snowpack, Intense rain and rapid snowmelt runoff |
| May-June 2011 | Statewide | 50 to >100 | Largest flood of record for Missouri River near Wolf Point and Yellowstone River near Livingston. Flooding most severe on the Musselshell River. | Above average mountain snowpack, spring rainfall, and extensive and late melting prairie snowpack |
Trends in flood-related precipitation.—Determining trends in flood events and their underlying causes is difficult due to the complex interplay of climate and human-related factors. Many studies have therefore examined flood-related precipitation events instead (Karl and Knight 1998; Kunkel 2003; McCabe et al. 2007).
Studies have shown an increase in global and North American extreme precipitation events since 1970 (Karl and Knight 1998; Peterson et al. 2013; Rood et al. 2016). In the US, increases in extreme precipitation have been most substantial in the East, while trends in the West appear to be mixed and location specific (Salathé et al. 2014).
McCabe et al. (2007) analyzed the frequency of rain-on-snow events at over 400 sites in the western US between 1949 and 2003 and found declining trends at lower elevations and increasing trends at higher elevations. Reductions in rain-on-snow events at lower elevations are attributed to declines in the extent of low-elevation snowpack caused by warming (McCabe et al. 2007). Increases at higher elevations are likely due to a high-elevation snowpack that has been largely unaltered by warming (Mote et al. 2005), combined with increased variability of late-fall-winter precipitation.
The above studies and others (e.g., Hamlet and Lettenmeier 2007) suggest that change in flood risk during the latter half of the 20th century has been a function of both precipitation (increased variability) and temperature (warming in mid winter). Climate-driven changes in both of these variables will continue to affect flood risk in the future.
Future flood risk.—Warming will continue to reduce mountain snowpack, and this could reduce flood risk related to rain-on-snow events by reducing the quantity of water available for release stored as snow (Cohen et al. 2015). Yet warming is also likely to increase the amount of winter and spring precipitation that falls as rain (particularly in rain-snow transition zones), which will accelerate snowmelt and could increase flood risk, depending on antecedent snowpack, soil moisture, and other conditions. As such, rising temperatures alone will influence flood risk, regardless of trends in precipitation (Salathé et al. 2014); yet the effects will likely be location- and event-specific and therefore difficult to predict (Cohen et al. 2015).
Future precipitation projections show a general increase in extreme events at a global scale (Min et al. 2011; Rood et al. 2016), and regional climate models also consistently predict increases in extreme precipitation in the northwestern US. In Montana, the frequency of wet events (days with more than 1 inch [2.5 cm] of rain) and variability in interannual precipitation are both projected to increase slightly by mid to late century (Figures 2-25 and 2-20).
There is considerable uncertainty surrounding future flood risk in response to climate change, and some research suggests that extreme precipitation events can actually intensify more quickly than what is projected by general circulation models (Min et al. 2011; also see section on GCMs in Climate chapter). Additionally, flood risk depends on specific storm characteristics that are difficult to capture in most models (Salathé et al. 2014). Moreover, the particular effects of projected changes in temperature and precipitation on flood risk will depend on location, elevation, and antecedent weather conditions, as well as human practices that impact flooding.
KEY KNOWLEDGE GAPS
- Water demand and management in the context of a changing climate.—Although the direct influences of climate change on water supply have received substantial attention (as evidenced by this assessment), much less is known about the intersection between changes in climate and water demand and/or water management. New solutions are needed that balance the multiple, and sometimes competing, demands for water in the context of changing or shifting water supplies (Poff et al. 2016). Communication and collaboration among multiple stakeholders, including universities, agencies, non-governmental organizations, and citizen groups, will be paramount. The regional basin water plans in Montana (e.g., MT DNRC 2014a-d) represent a bold and critical first step, but there is much work to be done.
- Improving the accuracy of models in Montana.—Many of the downscaled climate-hydrology projections are not yet calibrated for specific basins across Montana. Thus, when the models agree, we have relatively high confidence in the direction of projected changes, but much less confidence in the magnitude of future changes for specific river basins. The collaboration between MT DNRC and the Bureau of Reclamation (see sidebar) and other ongoing efforts associated with the Northwest Climate Science Center (Integrated scenarios project undated) are helping to close this gap, but additional modeling and local hydrologic expertise will be needed.
In addition, we know that groundwater-surface water interactions are central for projecting climate change impacts on water resources, particularly in snowmelt-dominated watersheds. These interactions are not typically integrated in hydrologic models, but such efforts will be necessary for improving our projections about climate change and water supply (Huntington and Niswonger 2012).
- Maintain and expand our water monitoring network.—Our knowledge about current and future water supplies depends critically on our ability to monitor the water cycle across Montana and beyond. Our current network of weather stations, streamflow gages, groundwater wells, and snowpack monitoring sites must be maintained and expanded to better represent ongoing changes in the state. Current collaborations between USGS, Montana Bureau of Mines and Geology, and the Montana DNRC are helping to support this monitoring network, but additional investment in this area will serve as insurance for managing a sustainable water future.
CONCLUSIONS
Future changes in climate will alter Montana’s hydrology. Although the specific magnitude of changes remains uncertain, two conclusions regarding the general character of changes can be made with high confidence:
- Rising temperatures will reduce accumulation of snowpack, shift historical patterns of streamflow in Montana, and likely result in additional stress on Montana’s water supply, particularly during the summer and early fall.
- Rising temperatures will exacerbate persistent drought periods that are a natural part of Montana’s climate.
The goal of this chapter has been to provide scientific data on the impacts of climate change on Montana’s water supply, which are crucial to the health of Montana’s agriculture, industry, municipalities, and human and natural ecosystems. Building resilience for the future will require:
- cooperation between legislators, planners, scientists, managers and water users across the state;
- a water use system that is flexible and able to adapt to changes in timing of water supply;
- a focus on other means for natural and artificial storage of water for use during times of high demand; and
- explicitly addressing the issue of water use and demand in conjunction with best data on climate and water supply
RECOMMENDED FURTHER READING
Jiménez Cisneros BE., Oki T, Arnell NW, Benito G, Cogley JG, Döll P, Jiang T, Mwakalila SS. 2014: Freshwater resources. In: Field CB, Barros VR, Dokken DJ, Mach KJ, Mastrandrea MD, Bilir TE,
Chatterjee M, Ebi KL, Estrada YO, Genova RC, Girma B, Kissel ES, Levy AN, MacCracken S, Mastrandrea PR, White LL, editors. Climate change 2014: impacts, adaptation, and vulnerability. Part A: global and sectoral aspects. Contribution of working group II to the fifth assessment report of the Intergovernmental Panel on Climate Change. Cambridge UK and New York NY: Cambridge University Press. p 229-69.
US Bureau of Reclamation. 2016. SECURE Water Act Section 9503(c)—Reclamation climate change and water 2016: prepared for United States Congress. Denver CO: Bureau of Reclamation, Policy and Administration. 307 p. Available online https://www.usbr.gov/climate/secure/docs/2016secure/2016SECUREReport.pdf. Accessed 2017 May11.
US Bureau of Reclamation. 2016. West-wide climate risk assessments—Columbia River basin climate impact assessment, final report: prepared for United States Congress. Denver CO: Bureau of Reclamation, Policy and Administration. 428 p.
[USBR] US Bureau of Reclamation. [forthcoming]. West-wide climate risk assessments—upper Missouri River basin climate impact assessment, final report: prepared for United States Congress. Denver CO: Bureau of Reclamation, Policy and Administration. Expected 2017 December.
Key snow and snowmelt hydrology publications:
Georgakakos A, Fleming P, Dettinger M, Peters-Lidard C, Richmond TC, Reckhow K, White K, Yates D. 2014. Water resources [chapter]. In: Melillo JM, Richmond T, Yohe GW, editors. Climate change impacts in the United States: the third national climate assessment. Washington DC: US Global Change Research Program. p 69-112. doi:10.7930/ J0G44N6T.
[MT DNRC] Montana Department of Natural Resources and Conservation. 2015. Montana State Water Plan: a watershed approach to the 2015 Montana state water plan. Helena MT: State of Montana, DNRC. 84 p. Available online http://dnrc.mt.gov/divisions/water/management/docs/state-water-plan/2015.... Accessed 2017 Mar 6.
Pederson GT, Gray ST, Ault T, Marsh W, Fagre DB, Bunn AG, Woodhouse CA, Graumlich LJ. 2011a. Climatic controls on the snowmelt hydrology of the northern Rocky Mountains. Journal of Climate 24:1666-87.
Pederson GT, Gray ST, Woodhouse CA, Betancourt JL, Fagre DB, Littell JS, Watson E, Luckman BH, Graumlich, LJ. 2011b. The unusual nature of recent snowpack declines in the North American cordillera. Science 333(6040):332-5.
Spears M, Harrison A, Sankovich V, Gangopadhyay S. 2013. Literature synthesis on climate change implications for water and environmental resources. 3rd ed. Denver CO: US Bureau of Reclamation, Research and Development Office. Technical memorandum 86-68210-2013-06. 352 p.
LITERATURE CITED
Abatzoglou JT. 2011. Influence of the PNA on declining mountain snowpack in the western United States. International Journal of Climatology 31(8):1135-42.
Al-Chokhachy R, Schmetterling D, Clancy C, Saffel P, Kovach RP, Nyce LG, Liermann B, Fredenberg WA, Pierce R. 2016. Are brown trout replacing or displacing bull trout populations in a changing climate? Canadian Journal of Fisheries and Aquatic Sciences 73:1395-404
Alley WM. 2016. Drought-proofing groundwater. Groundwater 54(3):309. doi.10.1111/gwat.12418.
Arnell NW. 1999. Climate change and global water resources. Global Environmental Change 9:S31-S49.
Ault TR, Cole JE, Overpeck JT, Pederson GT, Meko DM. 2014. Assessing the risk of persistent drought using climate model simulations and paleoclimate data. Journal of Climate 27(20):7529-49.
Bales RC, Molotch NP, Painter TH, Dettinger MD, Rice R, Dozier J. 2006. Mountain hydrology of the western United States. Water Resources Research 42(8)W08432. doi:10.1029/2005WR004387.
Barnett TP, Adam JC, Lettenmaier DP. 2005. Potential impacts of a warming climate on water availability in snow-dominated regions. Nature 438(7066):303-9.
Barnett TP, Pierce DW, Hidalgo HG, Bonfils C, Santer BD, Das T, Bala G, Wood AW, Nozawa T, Mirin AA, Cayan DR, Dettinger MD. 2008. Human-induced changes in the hydrology of the western United States. Science 319(5866):1080-3.
Bohr GS, Aguado E. 2001. Use of April 1 SWE measurements as estimates of peak seasonal snowpack and total cold-season precipitation. Water Resources Research 37(1):51-60.
Brown TC, Romano F, Ramirez JA. 2013. Projected freshwater withdrawals in the United States under a changing climate. Water Resources Research 49(3):1259-76.
Casola JH, Cuo L, Livneh B, Lettenmaier DP, Stoelinga MT, Mote PW, Wallace JM. 2009. Assessing the impacts of global warming on snowpack in the Washington Cascades. Journal of Climate 22(10):2758-72.
Cayan DR, Dettinger MD, Diaz HF, Graham NE. 1998. Decadal variability of precipitation over western North America. Journal of Climate 11(12):3148-66.
Cayan DR, Redmond KT, Riddle LG. 1999. ENSO and hydrologic extremes in the western United States. Journal of Climate 12(9):2881-93.
Chaney R. 2016 June 26. Satellite images show Glacier Park’s ice fields shrinking. Missoulian. Available online http://missoulian.com/news/local/satellite-images-show-glacier-park-s-ic.... Accessed 2017 May 19.
Climate Prediction Center. 2016. El Niño Southern Oscillation: Montana [website]. Available online http://www.cpc.ncep.noaa.gov/products/analysis_monitoring/ensostuff/stat.... Accessed 2017 May 8.
Clow DW. 2010. Changes in the timing of snowmelt and streamflow in Colorado: a response to recent warming. Journal of Climate 23(9):2293-306.
Cohen J, Ye H, Jones J. 2015. Trends and variability in rain on snow events. Geophysical Research Letters 42(17):7115-22.
Cook BI, Smerdon JE, Seager R, Coats S. 2014. Global warming and 21st century drying. Climate Dynamics 43(9-10):2607-27.
Cook ER, Seager R, Cane MA, Stahle DW. 2007. North American drought: reconstructions, causes, and consequences. Earth-Science Reviews 81(1):93-134.
Cook ER, Seager R, Heim RR, Vose RS, Herweijer C, Woodhouse C. 2010. Megadroughts in North America: placing IPCC projections of hydroclimatic change in a long-term palaeoclimate context. Journal of Quaternary Science 25(1):48-61.
Cook ER, Woodhouse CA, Eakin CM, Meko DM, Stahle DW. 2004. Long-term aridity changes in the western United States. Science 306(5698):1015-8.
Dai A. 2011. Drought under global warming: a review. Wiley Interdisciplinary Reviews: Climate Change 2(1):45-65.
Dai A. 2013. Increasing drought under global warming in observations and models. Nature Climate Change 3(1):52-8.
Das T, Hidalgo HG, Pierce DW, Barnett TP, Dettinger MD, Cayan DR, Bonfils C, Bala G, Mirin A. 2009. Structure and detectability of trends in hydrological measures over the western United States. Journal of Hydrometeorology 10(4):871-92.
Das T, Pierce DW, Cayan DR, Vano JA, Lettenmaier DP. 2011. The importance of warm season warming to western US streamflow changes. Geophysical Research Letters 38(23)L23403. doi:10.1029/2011GL049660
DeBeer CM, Pomeroy JW. 2009. Modelling snowmelt and snowcover depletion in a small alpine cirque, Canadian Rocky Mountains. Hydrological Processes 23(18):2584-99.
Dettinger MD, Cayan DR. 1995. Large-scale atmospheric forcing of recent trends toward early snowmelt runoff in California. Journal of Climate 8(3):606-23.
Dressler KA, Fassnacht SR, Bales RC. 2006. A comparison of snow telemetry and snow course measurements in the Colorado River basin. Journal of Hydrometeorology 7(4):705-12.
Earman S, Dettinger M. 2011. Potential impacts of climate change on groundwater resources—a global review. Journal of Water and Climate Change 2(4):213-29. doi:10.2166/wcc.2011.034.
Eby LA, Helmy O, Holsinger LM, Young MK. 2014. Evidence of climate-induced range contractions in bull trout Salvelinus confluentus in a Rocky Mountain watershed, USA. PloS ONE 9(6):e98812.
Ferguson SA. 2000. The spatial and temporal variability of rain-on-snow. In: editors unknown. Proceedings of the international snow science workshop; 2000 Oct 2-6; Big Sky MT. p 178-83. Available online http://arc.lib.montana.edu/snow-science/objects/issw-2000-178-183.pdf. Accessed 2017 May 8.
Fritts HC. 2012. Tree rings and climate. Amsterdam Netherlands: Elsevier. 582 p.
Gillan BJ, Harper JT, Moore JN. 2010. Timing of present and future snowmelt from high elevations in northwest Montana. Water Resources Research 46:W01507. doi:10.1029/2009WR007861.
Green TR, Taniguchi M, Kooi H, Gurdak JJ, Allen DM, Hiscock KM, Treidel H, Aureli A. 2011. Beneath the surface of global change: impacts of climate change on groundwater. Journal of Hydrology 405(3):532-60.
Hall MH, Fagre DB. 2003. Modeled climate-induced glacier change in Glacier National Park, 1850–2100. BioScience 53(2):131-40.
Hamlet AF, Lettenmaier DP. 1999. Effects of climate change on hydrology and water resources in the Columbia River basin. Journal of the American Water Resources Association 35(6):1597-623.
Hamlet AF, Lettenmaier DP. 2007. Effects of 20th century warming and climate variability on flood risk in the western US. Water Resources Research 43:W06427. doi:10.1029/2006WR005099.
Hamlet AF, Mote PW, Clark MP, Lettenmaier DP. 2005. Effects of temperature and precipitation variability on snowpack trends in the western United States. Journal of Climate 18(21):4545-61.
Hay LE, Markstrom SL, Ward-Garrison C. 2011. Watershed-scale response to climate change through the twenty-first century for selected basins across the United States. Earth Interactions 15(17):1-37.
Hoerling M, Eischeid J, Kumar A, Leung R, Mariotti A, Mo K, Schubert S, Seager R. 2014. Causes and predictability of the 2012 Great Plains drought. Bulletin of the American Meteorological Society 95(2):269-82.
Huntington JL, Niswonger RG. 2012. Role of surface-water and groundwater interactions on projected summertime streamflow in snow dominated regions: an integrated modeling approach. Water Resources Research 48:W11524. doi:10.1029/2012WR012319.
Integrated scenarios project. [undated]. Integrated scenarios of the future Northwest environment [website]. Available online http://climate.nkn.uidaho.edu/IntegratedScenarios/. Accessed 2017 Mar 6.
[IPCC] Intergovernmental Panel on Climate Change. 2014. Summary for policymakers. In: Edenhofer O, Pichs-Madruga R, Sokona Y, Farahani E, Kadner S, Seyboth K, Adler A, Baum I, Brunner S, Eickemeier P, Kriemann B, Savolainen J, Schlömer S, von Stechow C, Zwickel T, Minx JC, editors. Climate change 2014: mitigation of climate change. Contribution of working group III to the fifth assessment report of the Intergovernmental Panel on Climate Change. Cambridge UK and New York NY: Cambridge University Press. 32 p.
Isaak DJ, Wenger SJ, Peterson EE, Ver Hoef JM, Hostetler S, Luce CH, Dunham JB, Kershner J, Roper BB, Nagel DE, Chandler GL, Wollrab S, Parkes-Payne S, Horan DL. 2016. NorWeST regional database and modeled stream temperatures [website]. Boise ID: USDA Forest Service, Rocky Mountain Research Station. Available online www.fs.fed.us/rm/boise/AWAE/projects/NorWeST/ModeledStreamTemperatureSce.... Accessed 2017 May 19.
Isaak DJ, Wollrab SJ, Horan D, Chandler G. 2012. Climate change effects on stream and river temperatures across the northwest US from 1980–2009 and implications for salmonid fishes. Climatic Change 113:499–524.
Isaak DJ, Young MK, Nagel DE, Horan DL, Groce MC. 2015. The cold-water climate shield: delineating refugia for preserving salmonid fishes through the 21st century. Global Change Biology 21: 2540-53.
Jackson ST, Betancourt JL, Booth RK, Gray ST. 2009. Ecology and the ratchet of events: climate variability, niche dimensions, and species distributions. Proceedings of the National Academy of Sciences 106(Supplement 2):19685-92.
Kapnick S, Hall A. 2012. Causes of recent changes in western North American snowpack. Climate Dynamics 38(9-10):1885-99.
Karl TR, Knight RW. 1998. Secular trends of precipitation amount, frequency, and intensity in the United States. Bulletin of the American Meteorological Society 79:231–41.
Karl TR, Riebsame WE. 1989. The impact of decadal fluctuations in mean precipitation and temperature on runoff: a sensitivity study over the United States. Climatic Change 15(3):423-47.
Kim JS Jain S. 2010. High-resolution streamflow trend analysis applicable to annual decision calendars: a western United States case study. Climatic Change 102(3-4):699-707.
Klos PZ, Link TE, Abatzoglou JT. 2014. Extent of the rain-snow transition zone in the western US under historic and projected climate. Geophysical Research Letters 41(13):4560-8.
Knowles K. 2015. Trends in snow cover and related quantities at weather stations in the conterminous United States. Journal of Climate 28:7518-28.
Knowles K, Dettinger MD, Cayan DR. 2006. Trends in snowfall versus rainfall in the western United States. Journal of Climate 19(18):4545-59.
Kunkel KE. 2003. North American trends in extreme precipitation. Natural Hazards 29(2):291-305.
[LLNL] Lawrence Livermore National Lab. [undated]. Downscaled CMIP3 and CMIP5
climate and hydrology projections [website]. Available online http://gdo-dcp.ucllnl.org. Accessed 2017 Mar 6.
Leppi JC, DeLuca TH, Harrar SW, Running SW. 2012. Impacts of climate change on August stream discharge in the central Rocky Mountains. Climatic Change 112(3-4):997-1014.
Livneh B, Hoerling MP. 2016. The physics of drought in the US central Great Plains. Journal of Climate 29(18):6783-804.
Livneh B, Rosenberg EA, Lin C, Nijssen B, Mishra V, Andreadis KM, Maurer EP, Lettenmaier DP. 2013. A long-term hydrologically based dataset of land surface fluxes and states for the conterminous United States: update and extensions. Journal of Climate 26:9384–92.
Luce CH, Abatzoglou JT, Holden ZA. 2013. The missing mountain water: slower westerlies decrease orographic enhancement in the Pacific Northwest USA. Science 342(6164):1360-4.
Luce CH, Holden ZA. 2009. Declining annual streamflow distributions in the Pacific Northwest United States, 1948–2006. Geophysical Research Letters 36:L16401. doi:10.1029/2009GL039407.
Lukas J, Barsugli J, Doesken N, Rangwala I, Wolter K. 2014. Climate change in Colorado: a synthesis to support water resources management and adaptation. 2nd ed. Boulder CO: University of Colorado. 114 p.
Lute AC, Abatzoglou JT, Hegewisch KC. 2015. Projected changes in snowfall extremes and interannual variability of snowfall in the western United States. Water Resources Research 51: 960-72.
Lundquist JD, Dettinger MD, Stewart IT, Cayan DR. 2009. Variability and trends in spring runoff in the western United States [chapter]. In Wagner FH, editor. Climate warming in western North America: evidence and environmental effects. Salt Lake City UT: University of Utah Press. p 63-76.
MacDonald LH, Hoffman JA. 1995. Causes of peak flows in northwestern Montana and northeastern Idaho. Journal of the American Water Resources Association 31(1):79-95.
Mantua NJ, Hare SR. 2002. The Pacific Decadal Oscillation. Journal of Oceanography 58(1):35-44.
[MBMGa] Montana Bureau of Mines and Geology. [undated]. Ground water assessment [website]. Available online http://www.mbmg.mtech.edu/gwap/grw-assessment.asp. Accessed 2017 Mar 6.
[MBMGb] Montana Bureau of Mines and Geology. [undated]. Ground water information center [website]. Available online http://mbmggwic.mtech.edu/. Accessed 2017 Mar 6.
McCabe GJ, Clark MP. 2005. Trends and variability in snowmelt runoff in the western United States. Journal of Hydrometeorology 6(4):476-82.
McCabe GJ, Hay LE, Clark MP. 2007. Rain-on-snow events in the western United States. Bulletin of the American Meteorological Society 88(3):319-28.
McCabe GJ, Palecki MA, Betancourt JL. 2004. Pacific and Atlantic ocean influences on multi-decadal drought frequency in the United States. Proceedings of the National Academy of Sciences 101(12):4136-41.
McCabe GJ, Wolock DM. 2011. Independent effects of temperature and precipitation on modeled runoff in the conterminous United States. Water Resources Research 47:W11522. doi:10.1029/2011WR010630.
McCabe GJ, Wolock DM. 2015. Increasing Northern Hemisphere water deficit. Climatic Change 132(2):237-49.
Meixner T, Manning AH, Stonestrom DA, Allen DM, Ajami H, Blasch KW, Brookfield AE, Castro CL, Clark JF, Gochis DJ, Flint AL, Neff KL, Niraula R, Rodell M, Scanlon BR, Singha K, WalvoordMA. 2016. Implications of projected climate change for groundwater recharge in the western United States. Journal of Hydrology 534:124-38.
Melillo JM, Richmond TC, Yohe GW, editors. 2014. Highlights of climate change impacts in the United States: the third national climate assessment. Washington DC: US Global Change Research Program. 148 p.
Min SK, Zhang X, Zwiers FW, Hegerl GC. 2011. Human contribution to more-intense precipitation extremes. Nature 470(7334):378-81.
Moore JN, Harper JT, Greenwood MC. 2007. Significance of trends toward earlier snowmelt runoff, Columbia and Missouri basin headwaters, western United States. Geophysical Research Letters 34(16). doi:10.1029/2007GL031022.
Moore RD, Fleming SW, Menounos B, Wheate R, Fountain A, Stahl K, Holm K, Jakob M. 2009. Glacier change in western North America: influences on hydrology, geomorphic hazards and water quality. Hydrological Processes 23(1):42-61.
Mote PW. 2003. Trends in snow water equivalent in the Pacific Northwest and their climatic causes. Geophysical Research Letters 30(12):1601. doi:10.1029/2003GL017258.
Mote PW. 2006. Climate-driven variability and trends in mountain snowpack in western North America. Journal of Climate 19(23):6209-20.
Mote PW, Hamlet AF, Clark MP, Lettenmaier DP. 2005. Declining mountain snowpack in western North America. Bulletin of the American Meteorological Society 86(1):39-49.
Mote PW, Sharp D. 2016. Update [online report] to data originally published in: Mote PW, Hamlet AF, Clark MP, Lettenmaier DP. 2005. Declining mountain snowpack in western North America. Bulletin of the American Meteorological Society 86(1):39-49. Available online https://www.epa.gov/sites/production/files/2016-08/documents/snowpack_do.... Accessed 2017 May 15.
[MT DNRC] Montana Department of Natural Resources and Conservation. 2014a. Clark Fork and Kootenai River basins, water plan 2014. Helena MT: State of Montana, DNRC. 167 p. Available online http://dnrc.mt.gov/divisions/water/management/docs/state-water-plan/clar.... Accessed 2017 May 8.
[MT DNRC] Montana Department of Natural Resources and Conservation. 2014b. Lower Missouri River basin, water plan 2014. Helena MT: State of Montana, DNRC. 191 p. Available online http://dnrc.mt.gov/divisions/water/management/docs/state-water-plan/lowe.... Accessed 2017 May 8.
[MT DNRC] Montana Department of Natural Resources and Conservation. 2014c. Upper Missouri River basin, water plan 2014. Helena MT: State of Montana, DNRC. 219 p. Available online http://dnrc.mt.gov/divisions/water/management/docs/state-water-plan/uppe.... Accessed 2017 May 8.
[MT DNRC] Montana Department of Natural Resources and Conservation. 2014d. Yellowstone River basin, water plan 2014. Helena MT: State of Montana, DNRC. 186 p. Available online http://dnrc.mt.gov/divisions/water/management/docs/state-water-plan/yell.... Accessed 2017 May 9.
[MT DNRC] Montana Department of Natural Resources and Conservation. 2015. Montana State Water Plan: a watershed approach to the 2015 Montana state water plan. Helena MT: State of Montana, DNRC. 84 p. Available online http://dnrc.mt.gov/divisions/water/management/docs/state-water-plan/2015.... Accessed 2017 Mar 6.
[MT DNRC] Montana Department of Natural Resources and Conservation. [undated]. Drought management—streamflow [website]. Available online http://dnrc.mt.gov/divisions/water/drought-management. Accessed 2017 Mar 6.
Nolin AW, Phillippe J, Jefferson A, Lewis SL. 2010. Present-day and future contributions of glacier runoff to summertime flows in a Pacific Northwest watershed: implications for water resources. Water Resources Research 46(12):W12509. doi:10.1029/2009WR008968.
Norton PA, Anderson MT, Stamm JF. 2014. Trends in annual, seasonal, and monthly streamflow characteristics at 227 streamgages in the Missouri River watershed, water years 1960–2011. Reston VA: US Geological Survey. US Geological Survey Scientific Investigations Report 2014–5053. 128 p.
[NRCS] Natural Resources Conservation Service. [undated]. Snow survey and water supply [website]. Available online http://www.nrcs.usda.gov/wps/portal/nrcs/main/national/water/snowsurvey/. Accessed 2017 Mar 6.
Paulson RW, Chase EB, Roberts RS, Moody DW. 1991 National water summary 1988-89: hydrologic events and floods and droughts. Denver CO: USGS. United States Geological Survey water-supply paper 2375. 604 p.
Pederson GT, Betancourt JL, McCabe GJ. 2013a. Regional patterns and proximal causes of the recent snowpack decline in the Rocky Mountains, US. Geophysical Research Letters 40(9):1811-6.
Pederson GT, Fagre DB, Gray ST, Graumlich LJ. 2004. Decadal-scale climate drivers for glacial dynamics in Glacier National Park, Montana, USA. Geophysical Research Letters 31:L12203. doi:10.1029/2004GL019770.
Pederson GT, Graumlich LJ, Fagre DB, Kipfer T, Muhlfeld CC. 2010. A century of climate and ecosystem change in western Montana: what do temperature trends portend? Climatic Change 98(1-2):133-54.
Pederson GT, Gray ST, Ault T, Marsh W, Fagre DB, Bunn AG, Woodhouse CA, Graumlich LJ. 2011a. Climatic controls on the snowmelt hydrology of the northern Rocky Mountains. Journal of Climate 24(6):1666-87.
Pederson GT, Gray ST, Fagre DB, Graumlich LJ. 2006. Long-duration drought variability and impacts on ecosystem services: a case study from Glacier National Park, Montana. Earth Interactions 10(4):1-28.
Pederson GT, Gray ST, Woodhouse CA, Betancourt JL, Fagre DB, Littell JS, Watson E, Luckman BH, Graumlich, LJ. 2011b. The unusual nature of recent snowpack declines in the North American cordillera. Science 333(6040):332-5.
Pederson GT, Gray ST, Woodhouse CA, Betancourt JL, Fagre DB, Littell JS, Watson E, Luckman BH, Graumlich LJ. 2013b. Long-term snowpack variability and change in the North American cordillera. Quaternary International 310:240.
Peterson TC, Heim Jr RR, Hirsch R, Kaiser DP, Brooks H, Diffenbaugh NS, and 22 more. 2013. Monitoring and understanding changes in heat waves, cold waves, floods, and droughts in the United States: state of knowledge. Bulletin of the American Meteorological Society 94(6):821-34.
Pierce DW, Barnett TP, Hidalgo HG, Das T, Bonfils C, Santer BD, and 6 more. 2008. Attribution of declining western US snowpack to human effects. Journal of Climate 21(23). Available online http://journals.ametsoc.org/doi/full/10.1175/2008JCLI2405.1. Accessed 2017 May 9.
Poff NL, Brown CM, Grantham TE, Matthews JH, Palmer MA, Spence CM, Wilby RL, Haasnoot M, Mendoza GF, Dominique KC, Baeza A. 2016. Sustainable water management under future uncertainty with eco-engineering decision scaling. Nature Climate Change 6:25-34.
Pomeroy J, Essery R, Toth B. 2004. Implications of spatial distributions of snow mass and melt rate for snow-cover depletion: observations in a subarctic mountain catchment. Annals of Glaciology 38(1):195-201.
Power TM, Power DS. 2015. The impact of climate change on Montana’s outdoor economy. Prepared for the Montana Wildlife Federation by Power Consulting Inc. 73 p. Available online http://montanawildlife.org/wp-content/uploads/2015/12/Impact-of-Climate-.... Accessed 2017 May 9.
Power TM, Power DS. 2016. The impact of climate change on Montana’s agricultural economy. Prepared for Montana Farmers’ Union by Power Consulting Inc. 28 p. Available online http://montanafarmersunion.com/wp-content/uploads/2016/02/FINAL_Impact_C.... Accessed 2017 May 9.
Regonda SK, Rajagopalan B, Clark M, Pitlick J. 2005. Seasonal cycle shifts in hydroclimatology over the western United States. Journal of Climate 18(2):372-84.
Rood SB, Foster SG, Hillman EJ, Luek A, Zanewich KP. Flood moderation: declining peak flows along some Rocky Mountain rivers and the underlying mechanism. Journal of Hydrology 536:174-82.
Rood SB, Pan J, Gill KM, Franks CG, Samuelson GM, Shepherd A. 2008. Declining summer flows of Rocky Mountain rivers: changing seasonal hydrology and probable impacts on floodplain forests. Journal of Hydrology 349(3):397-410.
Salathé Jr EP, Hamlet AF, Mass CF, Lee SY, Stumbaugh M, Steed R. 2014. Estimates of twenty-first-century flood risk in the Pacific Northwest based on regional climate model simulations. Journal of Hydrometeorology 15(5):1881-99.
Schubert SD, Stewart RE, Wang H, Barlow M, Berbery EH, Cai W, and more. 2016. Global meteorological drought: a synthesis of current understanding with a focus on SST drivers of precipitation deficits. Journal of Climate 29(11):3989-4019.
Science for Nature and People Partnership. [undated]. Working group: ecological drought [website]. Available online http://snappartnership.net/groups/ecological-drought/. Accessed 2017 July 29.
Seager R, Hoerling M. 2014. Atmosphere and ocean origins of North American droughts. Journal of Climate 27(12):4581-606.
Serreze MC, Clark MP, Armstrong RL, McGinnis DA, Pulwarty RS. 1999. Characteristics of the western United States snowpack from snowpack telemetry (SNOTEL) data. Water Resources Research 35(7):2145-60.
Sheffield J, Wood EF. 2008. Projected changes in drought occurrence under future global warming from multi-model, multi-scenario, IPCC AR4 simulations. Climate Dynamics 31(1):79-105.
Sheffield J, Wood EF, Roderick ML. 2012. Little change in global drought over the past 60 years. Nature 491(7424):435-8.
Silverman NL, Maneta MP. 2016. Detectability of change in winter precipitation within mountain landscapes: spatial patterns and uncertainty. Water Resources Research 52(6):4301-20.
Stewart IT, Cayan DR, Dettinger MD. 2004. Changes in snowmelt runoff timing in western North America under a business as usual climate change scenario. Climatic Change 62(1-3):217-32.
Stewart IT, Cayan DR, Dettinger MD. 2005. Changes toward earlier streamflow timing across western North America. Journal of Climate 18(8):1136-55.
Stocker TF, Qin D, Plattner G-K, Tignor M, Allen SK, Boschung J, Nauels A, Xia Y, Bex V, Midgley PM, editors. 2013. Climate change 2013: the physical science basis. Contribution of working group I to the fifth assessment report of the Intergovern¬mental Panel on Climate Change. Cambridge UK and New York NY: Cambridge University Press. 1535 p.
Strzepek K, Yohe G, Neumann J, Boehlert B. 2010. Characterizing changes in drought risk for the United States from climate change. Environmental Research Letters 5(4):044012. doi:10.1088/1748-9326/5/4/044012.
Swann AL, Hoffman FM, Koven CD, Randerson JT. 2016. Plant responses to increasing CO2 reduce estimates of climate impacts on drought severity. Proceedings of the National Academy of Sciences 113(36):10019-24.
Taylor RG, Scanlon B, Döll P, Rodell M, Van Beek R, Wada Y, and 20 more. 2013. Ground water and climate change. Nature Climate Change 3(4):322-9.
Tesemma ZK, Wei Y, Peel MC, Western AW. 2015. Including the dynamic relationship between climatic variables and leaf area index in a hydrological model to improve streamflow prediction under a changing climate. Hydrology and Earth System Sciences 19(6):2821-36.
Trenberth KE, Dai A, van der Schrier G, Jones PD, Barichivich J, Briffa KR, Sheffield J. 2014. Global warming and changes in drought. Nature Climate Change 4(1):17-22.
Udall B. 2013. Water: impacts, risks, and adaptation [chapter]. In: Garfin G, Jardine A, Merideth R, Black M, LeRoy S, editors. Assessment of climate change in the southwest United States: a report prepared for the National Climate Assessment by the Southwest Climate Alliance. Washington DC: Island Press. p 197-217.
[US Army CRREL] US Army Cold Regions Research and Engineering Laboratory [undated]. Ice jam database [website]. Available online http://icejams.crrel.usace.army.mil/icejam/ijdatabase.html. Accessed 2017 Mar 6.
[USBR] US Bureau of Reclamation. 2014a. Downscaled CMIP3 and CMIP5 climate and hydrology projections: release of hydrology projections, comparison with preceding information, and summary of user needs. Denver CO: US Department of the Interior, Bureau of Reclamation, Technical Services Center. 110 p.
[USBR] US Bureau of Reclamation. 2014b. Missouri headwater basin study [online report]. Montana: US Bureau of Reclamation. 1 p. Available online https://www.usbr.gov/watersmart/bsp/docs/fy2014/missouriheadwater.pdf. Accessed 2017 Mar 6.
[USBR] US Bureau of Reclamation. 2016. West-wide climate risk assessments—Columbia River basin climate impact assessment, final report: prepared for United States Congress. Denver CO: Bureau of Reclamation, Policy and Administration. 428 p.
[USBR] US Bureau of Reclamation. [forthcoming]. West-wide climate risk assessments—upper Missouri River basin climate impact assessment, final report: prepared for United States Congress. Denver CO: Bureau of Reclamation, Policy and Administration. Expected 2017 December.
[USDA-NASS] US Department of Agriculture—National Agricultural Statistics Service. 2015. National Agricultural Statistics Service [website]. Available online https://www.nass.usda.gov. Accessed 2017 May 9.
[USFS-RMRS] US Forest Service-Rocky Mountain Research Station. [undated]. NorWest Stream Temp: regional database and modelled stream temperatures [website]. Available online http://www.fs.fed.us/rm/boise/AWAE/projects/NorWeST.html. Accessed 2017 Mar 6.
[USGS] US Geological Survey, Northern Rocky Mountain Science Center. 2016. Repeat photography project [website]. Available online https://www.usgs.gov/centers/norock/science/repeat-photography-project?q.... Accessed 2017 May 9.
[USGS] US Geological Survey. [undated]. Multi-century perspectives on current and future streamflow in the Missouri River Basin [website]. Available online https://www.usgs.gov/centers/norock/science/multi-century-perspectives-c.... Accessed 2017 Mar 6.
Vano JA, Scott MJ, Voisin N, Stöckle CO, Hamlet AF, Mickelson KE, Elsner MM, Lettenmaier DP. 2010. Climate change impacts on water management and irrigated agriculture in the Yakima River Basin, Washington, USA. Climatic Change 102(1-2):287-317.
Vörösmarty CJ, Green P, Salisbury J, Lammers RB. 2000. Global water resources: vulnerability from climate change and population growth. Science 289(5477):284-8.
Wang SY, Hipps L, Gillies RR, Yoon JH. 2014. Probable causes of the abnormal ridge accompanying the 2013–2014 California drought: ENSO precursor and anthropogenic warming footprint. Geophysical Research Letters 41(9):3220-6.
Wilhite DA. 2000. Drought as a natural hazard: concepts and definitions [chapter]. In: Wilhite DA, editor. Drought: a global assessment, Vol. I. London: Routledge. p 3–18.
Whitfield PH. 2013. Is “centre of volume” a robust indicator of changes in snowmelt timing? Hydrological Processes 27(18):2691-8.
Woodhouse CA, Pederson GT, Morino K, McAfee SA, McCabe GJ. 2016. Increasing influence of air temperature on upper Colorado River streamflow. Geophysical Research Letters 43(5):2174-81.
[WRCC] Western Regional Climate Center. [undated]. Montana climate summary [website]. Available online http://www.wrcc.dri.edu/narratives/montana/. Accessed 2017 May 9.
Zwiers FW, Alexander LV, Hegerl GC, Knutson TR, Kossin JP, Naveau P, Nicholls N, Schär C, Seneviratne SI, Zhang, X. 2013. Climate extremes: challenges in estimating and understanding recent changes in the frequency and intensity of extreme climate and weather events [chapter]. In: Asrar GR, Hurrell JW, editors. Climate science for serving society: research, modeling and prediction priorities. Netherlands: Springer. p 339-89.
11 A reminder that throughout the MCA we assess our confidence in the key messages by considering a) the level of agreement among experts with relevant knowledge, and b) the quality of the evidence. We use these two factors and the criteria described in the National Climate Assessment to assign the confidence ratings expressed in this chapter. See sidebar titled “Expressed Confidence in MCA Key Messages” in the Introduction chapter.
12 1 acre-foot is 325,851 gal (1233 m3), enough water to cover an acre of land 1 ft (0.3 m) deep.
13 For more detail on our focal rivers and watersheds, see Appendix 3-1 on the MCA website.
14 The characterization of climate division 4 focuses on the plains basins within the division.
15 For more detail on our snowpack analysis methods see Appendix 3-2 on the MCA website.
16 For more detail on our snowpack analysis methods see Appendix 3-2 on the MCA website.
17 Center of timing refers to the calendar date at which half the total annual volume of streamflow has passed a given streamflow
gauging station.
18 For an explanation of methods see Appendix 3-2 on the MCA website.
19 Marias at Chester is the closest downstream gage to Marias at Shelby, one of our focal gages. Gages in this particular analysis were selected by the Basin Study of the Missouri River watershed (see earlier sidebar).
20 Yellowstone at Corwin Spring is not one of our focal rivers, but it is included here to show additional variation in drivers of annual flow.
21 Ecological drought has also been defined recently by a Science for Nature and People Partnership working group. Their definition is a prolonged and widespread deficit in naturally available water supplies that creates multiple stresses across ecosystems (Science for Nature and People Partnership undated).